1
$\begingroup$

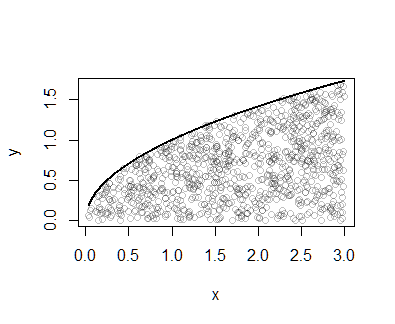
I want to sample uniformly from the area bounded by $y=0$, $x=3$, and $y=\sqrt{x}$: enter image description here

If I draw $x$ from $U[0, 3]$ and $y$ from $U[0, \sqrt{x}]$, the density will be higher in the bottom left corner: enter image description here
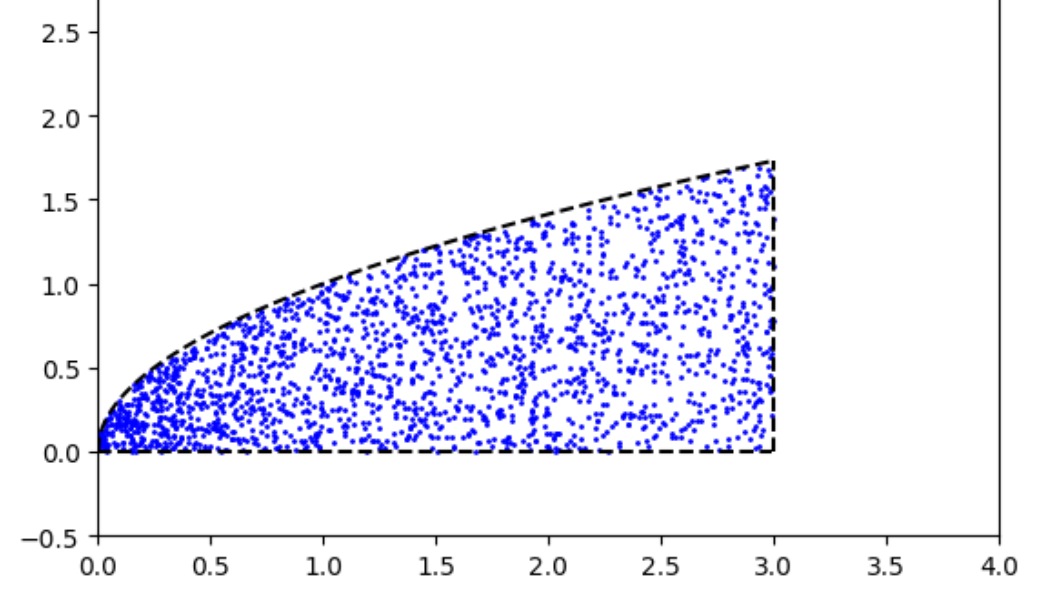
I tried to fix this by making the number of points on a region bounded by $x=a \in [0, 3]$ on the right, the square root curve, and the $x$-axis proportional to its area (relative to that of the entire figure).

So, the total area should be: $$\int_{0}^{3}\sqrt{x}dx = \frac{2}{3}x^{\frac{3}{2}}\bigg\rvert_{0}^{3}=2\sqrt{3}$$

The area bounded by $x=a$ on the right is $\frac{2}{3}a^{\frac{3}{2}}$, so the pdf of $x$ should be proportional to the ratio, i.e.: $$ pdf(x) = C \times \frac{\frac{2}{3}a^{\frac{3}{2}}}{2\sqrt{3}} = \frac{C}{3\sqrt{3}}a^{\frac{3}{2}} $$

The corresponding CDF is then:

$$ CDF(x) = \int_{0}^{x} pdf(u)du = \int_{0}^{x} \frac{C}{3\sqrt{3}}u^{\frac{3}{2}}du = \frac{C}{3\sqrt{3}} \times \frac{2}{5} u^{\frac{5}{2}} \bigg\rvert_{0}^{x} $$

$$ CDF(x) = \frac{C}{3\sqrt{3}} \times \frac{2}{5} x^{\frac{5}{2}} = \frac{2C}{5\times3\sqrt{3}} x^{\frac{5}{2}} $$

I get $C$ from the condition $CDF(3)=1$: $$ CDF(3) = \frac{2C}{5\times3\sqrt{3}} 3^{\frac{5}{2}} = \frac{2C}{5}\times 3 = \frac{6C}{5} = 1 $$ So: $$ C = \frac{5}{6} \implies \quad CDF(x) = \left(\frac{x}{3}\right)^{\frac{5}{2}} $$

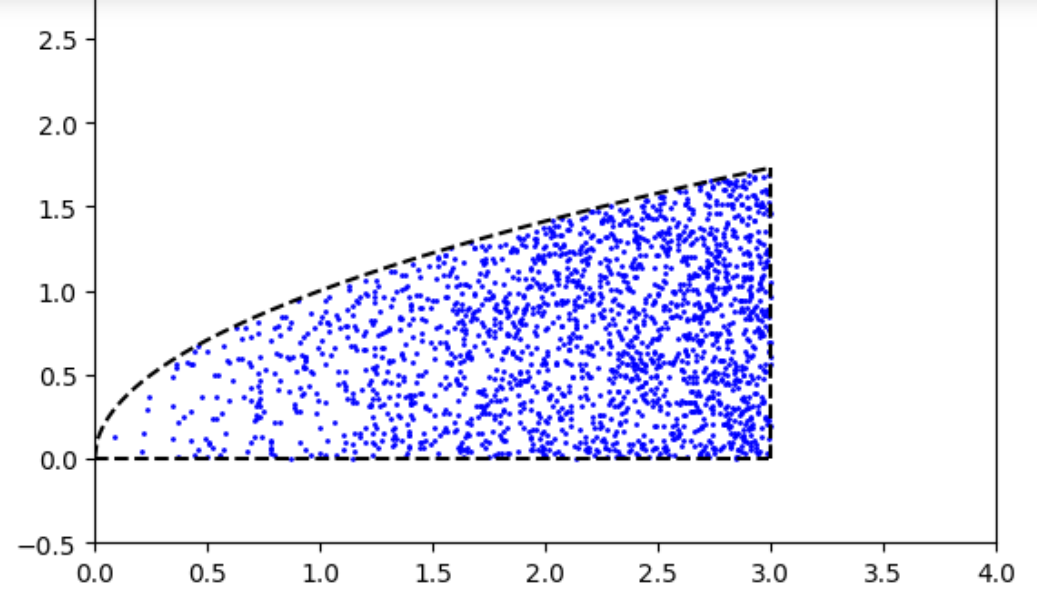
Therefore, I should sample $x$ by sampling a random number $r \in Uniform[0, 1]$ and solving $CDF(x)=r$ for $x$: $$ x = 3 \times r^{\frac{2}{5}} \quad (r \in Uniform[0,1]) $$

and get $y$ by sampling from $Uniform[0, \sqrt{x}]$. However, this approach doesn't make the distribution uniform: enter image description here The sampled points are now concentrated away from the bottom left corner.
Can someone help me? :)

$\endgroup$
1
  • 7
    $\begingroup$ in terms of simplicity of implementation, it's going to be hard to beat rejection sampling: sample many $u\sim U([0,3]\times[0,\sqrt{3}]$. Keep only those for which $u_y\leq\sqrt{u_x}$. That's your sample. $\endgroup$ Commented Jun 26, 2023 at 17:48

1 Answer 1

3
$\begingroup$

The distribution of $y$ conditional on $x$ is uniformly distributed between $0$ and $\sqrt x.$

Within any narrow vertical strip of width $\mathrm dx$ around $x$ you want the frequency of points to be proportional to $\sqrt{x}\,\mathrm d x$. Adding these up (integrating) tells us the cumulative distribution of the $x$ coordinates must be proportional to $x^{3/2}.$ Since the full proportion of $1$ is attained at $x=3,$ the distribution function must be

$$F_X(x) = \left(\frac{x}{3}\right)^{3/2}.$$

The most direct way to sample from this distribution is by generating uniform quantiles. That is, when $U$ has a uniform distribution on $[0,1],$

$$F_x^{-1}(U) = 3U^{2/3}$$

has the distribution $F_X.$

Thus, by generating $2n$ uniform random variates you can obtain $n$ points uniformly drawn from this region.

Here is an implementation in R.

n <- 1e3; y <- sqrt(x <- 3 * runif(n) ^ (2/3)) * runif(n)

A scatterplot might look like this:

enter image description here

One way to check the validity is to slice a set of points horizontally in a thin band and check for a uniform distribution, except near the smallest values (where there will an edge effect). After generating a million points, for instance, I plotted a thin band around $y=1.5$ with the commands

dy <- 0.01
y0 <- 1.5
hist(x[abs(y - y0) <= dy/2])

There were 2140 points with this nearly uniform histogram:

enter image description here

Similar histograms emerge at other values of y0.

$\endgroup$

Your Answer

By clicking “Post Your Answer”, you agree to our terms of service and acknowledge you have read our privacy policy.

Not the answer you're looking for? Browse other questions tagged or ask your own question.