0
$\begingroup$

I am wondering if both the coefficients can be identified in a causal sense given the context and the resulting multiple regression equation.

Imagine a scenario where we have two investment alternatives denoted $X_1$ and $X_2$, and sales denoted $Y$.

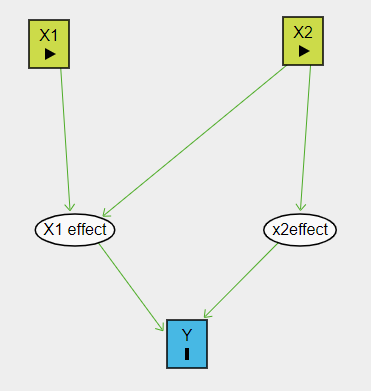
We assume that $X_2$ affects the effect of $X_1$ on $Y$, as well as having a direct effect on $Y$.

Note that $X_2$ affects the effect of $X_1$ on the outcome $Y$ and not the actual value of $X_1$.

I conceptualize this by the following graph:

enter image description here

Where as green-yellow denotes observed treatment variable, oval white denotes unobserved variable and blue rectangle denotes outcome.


I formalize this graph with the following equation: $\begin{equation} Y = b_0 + b_1 * X1 + b_2 * X2 + b_3 * x1 * x2 + \epsilon \end{equation}$

I am facing challenges in understanding whether there should be a direct arrow between $X2$ and $X1$, and arrows directly to sales from the input variables $X1$ and $X2$ instead of having the unobserved effect nodes. Please note that $X2$ does not cause $X1$, but it does influence the effect that $X1$ has on the outcome.

As there are no edges pointing into $X2$ and $X1$, I believe the backdoor criterion is satisfied. However, the equation troubles me since I would propose the same equation given the following scenario: an edge $X1 \rightarrow X2\text{effect}$ and no edge between $X2 \rightarrow X1\text{effect}$.


Question: is this graphical representation correct given the problem context and secondly, can the estimates be concluded causal by the proposed equation?

$\endgroup$

1 Answer 1

1
$\begingroup$

You're really asking several questions here, which isn't the best use of this site, but we can provide some pointers.

We assume that 𝑋2 affects the effect of 𝑋1 on 𝑌, as well as having a direct effect on 𝑌.

This pattern is called "moderation", and you can find a huge amount of guidance if you search for that term, particularly if you assume, as you do, that all relationships are linear. This graph can actually be expressed as a straightforward linear regression model:

$y = \alpha + b_1 x_1 + b_2 x_2 + b_{12}x_1x_2 + \epsilon$

where $b_{12}$ is the interaction coefficient (see "Moderation" versus "interaction"?).

I am facing challenges in understanding whether there should be a direct arrow between 𝑋2 and 𝑋1, and arrows directly to sales from the input variables 𝑋1 and 𝑋2 instead of having the unobserved effect nodes. Please note that 𝑋2 does not cause 𝑋1, but it does influence the effect that 𝑋1 has on the outcome.

When drawing the DAG for causal inference, arrows just represent dependencies, they don't say anything about what the relationship actually is. Since X1 effect just represents the effect of x1 on y, it wouldn't make sense to have an arrow from x1 to y that bypasses this node. However, when actually estimating the model using linear regression, you would want to include the $b_1 x_1$ term in the model, since this captures the linear relationship between x1 and y when x2 $=$ 0.

However, the equation troubles me since I would propose the same equation given the following scenario: an edge 𝑋1→𝑋2effect and no edge between 𝑋2→𝑋1effect.

Yes, lots of people get confused by this, but it's fine. See https://www.theanalysisfactor.com/whats-in-a-name-moderation-and-interaction-independent-and-predictor-variables/

Question: a) is this graphical representation correct given the problem context and b), can the estimates be concluded causal by the proposed equation?

a) Yes, given what I said above, and b) yes, if you are willing to assume this graph is accurate, but interpreting regression estimates in the presence of interaction terms is tricky.

$\endgroup$
0

Your Answer

By clicking “Post Your Answer”, you agree to our terms of service and acknowledge you have read our privacy policy.

Not the answer you're looking for? Browse other questions tagged or ask your own question.