1
$\begingroup$

Suppose we have $n$ independent coins, each of which has an unknown and different probability of coming up heads. We have a magical machine that guesses the probabilities of each coin coming up heads. For $n=5$ coins, its guesses might look like 0.03, 0.45, 0.17, 0.91, 0.76. Then we flip each coin once and record the results, which might be heads, tails, tails, heads, heads. Our question: is there a statistical test that evaluates how accurate the machine is?

My first intuition was a chi-squared test like Pearson's or possibly a G-test, where our observed value is 1 if heads and 0 if otherwise. However, the data isn't categorical, nor do the observed values sum to a known constant. I also considered a Kolmogorov-Smirnov test to compare the expected with the observed, but neither are probability distributions.

I'm not sure how to phrase my preferences mathematically, but I'll try to do them qualitatively:

  • edit: any prediction of, say, $p=0.5$ by the machine should be interpreted to say that the machine has evidence that 50% of coins with this probability will land heads and should be rewarded accordingly if the proportion of heads for coins with this probability is very close to 50%; it does not mean that the machine is clueless and ambivalent on heads/tails
  • accuracy should be determined mostly on heads ratio: for instance, when the machine guesses 0.2 for every coin in a set, we should consider it accurate if 1 out of 5 landed heads or if 11 out of 50 landed on heads, but inaccurate if 3 out of 5 landed heads
  • true probabilities might not be uniformly distributed from 0 to 1
  • optional: accuracy should be reasonably tolerant of singular, highly unlikely events

Sorry if a similar question has been asked before—I'm very new to this site and statistics in general, but hopefully this question is clear enough.

Edit: As a response to a posted answer, we are not looking for Bernoulli proper scoring rules. To see why, suppose our machine predicts $p=0.5$ for all of 100 coins. In situation A, 50 coins land heads up, and in situation B, 95 coins land heads up. Clearly, the machine was a better predictor in situation A, which should be reflected in our test. However, the log-loss and Brier scoring rules, for example, each return the same score in both situations: $$\text{log-loss score, situation A}=-\frac{1}{100}\left(\sum_{n=0}^{50}\ln0.5+\sum_{n=51}^{100}\ln(1-0.5)\right)\approx0.69$$ $$\text{log-loss score, situation B}=-\frac{1}{100}\left(\sum_{n=0}^{95}\ln0.5+\sum_{n=96}^{100}\ln(1-0.5)\right)\approx0.69$$ $$\text{Brier score, situation A}=\frac{1}{100}\left(\sum_{n=0}^{50}(1-0.5)^2+\sum_{n=51}^{100}(0-0.5)^2\right)=0.25$$ $$\text{Brier score, situation B}=\frac{1}{100}\left(\sum_{n=0}^{95}(1-0.5)^2+\sum_{n=96}^{100}(0-0.5)^2\right)=0.25$$ The machine's predictions should be evaluated in aggregate. The machine's individual predictions should not be evaluated against its individual corresponding outcomes.

$\endgroup$
4
  • $\begingroup$ You have probabilistic predictions of Bernoulli experiments. In this context, the tool of choice to assess accuracy is proper scoring rules. They will happily deal with different predictions per experiment. However, these typically are not used in a hypothesis testing framework. $\endgroup$ Commented Mar 26 at 8:31
  • $\begingroup$ I'm not quite clear what you are looking for when you ask about hypothesis tests. Yes, you can test whether the predictions generated by the machine are uniform, is this what you are looking for? But that of course has nothing to do with whether these predictions describe any experiment and with what outcome you observe. Alternatively, do you want to test the null hypothesis that your machine generates predictions that correctly describe each experiment's chance of success? That should also be possible, but that is a different thing. $\endgroup$ Commented Mar 26 at 8:34
  • $\begingroup$ Sorry for the confusion—our hypothesis testing was if the predictions matched the experiment. I've edited the post to remove the confusion. Also, if I'm interpreting it correctly, most scoring rules only compare each predicted value with its corresponding experimental value, but that doesn't work well for binary heads-tail outcomes. For example, if the machine guesses 0.25 for 4 coins and 1 is a head, then most scoring rules would say that it is fairly inaccurate—a result of {1, 0, 0, 0} is very different from {0.25, 0.25, 0.25, 0.25}. But the fraction of coins that it guessed was correct. $\endgroup$ Commented Mar 26 at 8:45
  • $\begingroup$ Binary experiments are exactly what scoring rules are for. Crucially, they are more relevant for comparing different (sets of) predictions, than for saying whether one set of predictions is accurate or inaccurate. If you have one success followed by three failures, then of course a prediction of (1,0,0,0) will have a better score than one of (0.25,0.25,0.25,0.25) - but the latter will still have a better score than (0.1,0.1,0.1,0.1) or (0.8,0.1,0.6,1). I will try to write up a possible answer for your actual question. $\endgroup$ Commented Mar 26 at 9:07

1 Answer 1

0
$\begingroup$

There are possibilities of formally testing the null hypothesis that your machine's predictions give the correctly calibrated probabilities of the experiments you observe.

Recall the definition of a p value. It starts with a test statistic, which is a single number derived from your observations. The p value is defined as the probability of observing a test statistics at least as extreme as the one you actually did observe, under the assumption that the null hypothesis is true.

What test statistic shall we use? The established way of assessing the quality of probabilistic predictions is proper scoring rules. I personally prefer the log loss, so that is what I will use here. An alternative would be the Brier score, see that last link.

The procedure is as follows:

  1. Given your probabilistic predictions, generate a sequence of Bernoulli trials with the predicted success probabilities. For this generated sequence, calculate the log loss.
  2. Do step 1 many times, e.g., 10,000 times. You now have 10,000 random log losses under the null hypothesis (because the observations were generated according to your predictions).
  3. Calculate the log loss of your predictions for the actual observations you have.
  4. Find out which proportion of the simulated log losses is larger than your actually observed log loss.

As an example, suppose that we have nine trials with actual success probabilities $q_1 = (0.1, \dots, 0.9)$. (Of course, we don't know this.) We have observed this sequence:

FALSE FALSE FALSE FALSE FALSE  TRUE FALSE FALSE  TRUE

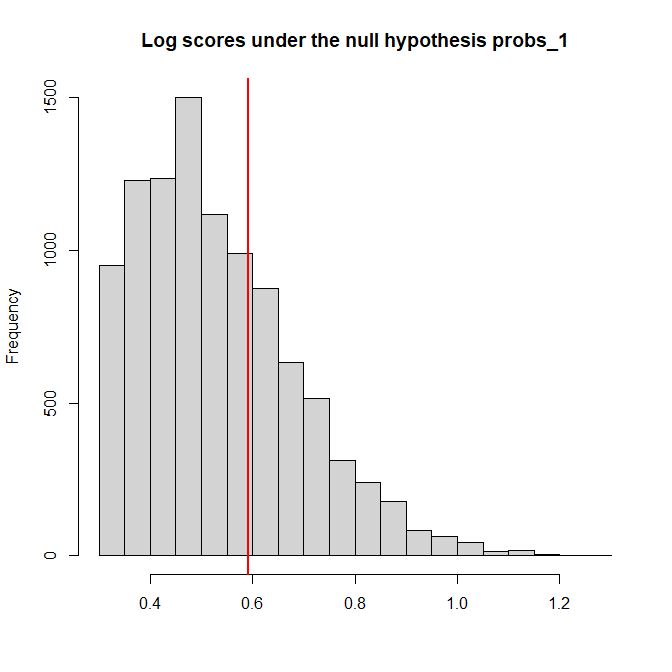
First, assume that we actually do have predictions that match the true probabilities. Running the procedure above gives us the following histogram of log losses, with the actually observed log loss (of 0.591) indicated by a red vertical line:

histogram of log losses under the null hypothesis for q_1

We find that 2,977 of our 10,000 simulated log losses are larger (i.e., more extreme) than the actually observed log loss, so $p=0.2977$.

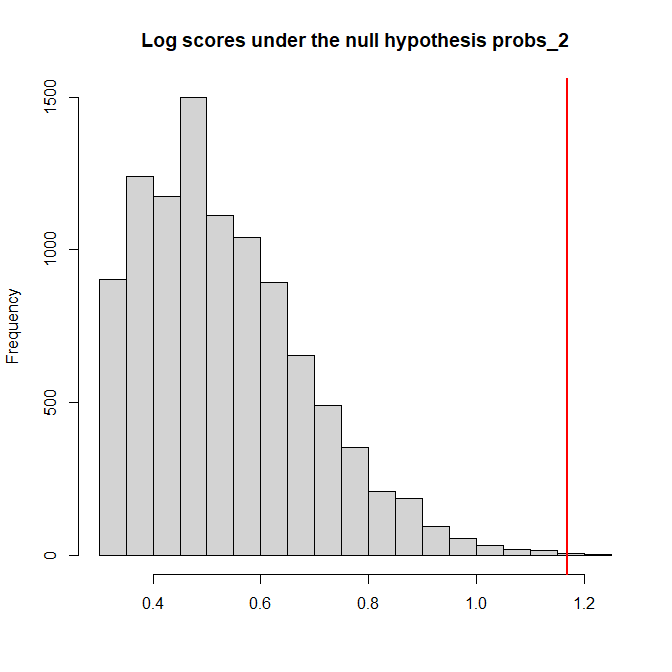
Second, assume that our prediction is wrong: instead of the true probabilities, we predict $q_2=(0.9, \dots, 0.1)$. In this case, we observe a log loss of 1.170. Under this null hypothesis, the log losses look like this:

histogram of log losses under the null hypothesis for q_2

This time, only 8 of 10,000 simulated log losses are larger than the actually observed one, so $p=0.0008$, and we will reject the null hypothesis that $q_2$ contains the true probabilities at standard alpha thresholds.

(If we had both predictions $q_1$ and $q_2$, then we could immediately say that $q_1$ is a better prediction than $q_2$ base on the lower log score alone. But that is not what you are asking.)

Of course, you can re-run the analysis using the Brier score or any other proper scoring rule for Bernoulli experiments.

Standard caveats of null hypothesis significance testing apply: statistical significance is not the same as clinical/economic/substantial significance; you can and will have both Type I and Type II errors; if your sample size is large, even tiny deviations from the true value will give you a significant result.

R code:

rm(list=ls())
probs_1 <- seq(0.1,0.9,by=0.1)
probs_2 <- 1-probs_1

set.seed(0)
(obs <- runif(length(probs_1))<probs_1)

log_score <- function(obs, preds) {
    -mean(obs*log(preds)+(1-obs)*log(1-preds))
}

sim_log_scores <- function(predictions, n_sims=1e4) {
    result <- rep(NA,n_sims)
    for ( ii in 1:n_sims ) {
        set.seed(ii)
        sim_obs <- runif(length(predictions))<predictions
        result[ii] <- log_score(sim_obs, predictions)
    }
    result
}

sims_1 <- sim_log_scores(probs_1)
(log_score_1 <- log_score(obs, probs_1))
hist(sims_1,main="Log scores under the null hypothesis probs_1",xlab="")
abline(v=log_score_1,lwd=2,col="red")
1-ecdf(sims_1)(log_score_1)

sims_2 <- sim_log_scores(probs_2)
(log_score_2 <- log_score(obs, probs_2))
hist(sims_2,main="Log scores under the null hypothesis probs_2",xlab="")
abline(v=log_score_2,lwd=2,col="red")
1-ecdf(sims_2)(log_score_2)
$\endgroup$
2
  • $\begingroup$ Thank you so much for the thoughtful response! Unfortunately, I think I articulated my concerns incorrectly in my earlier comment. Suppose our machine predicts p=0.5 for 100 coins. In situation A, 50 coins land heads and in situation B, 95 land heads. If I understand correctly, log-loss and Brier would each yield the same score for the two situations, even though the machine predicted situation A better. (Log-loss adds 0.69 and Brier adds 0.25 for every coin toss in this situation, regardless of heads/tails.) $\endgroup$ Commented Mar 26 at 21:07
  • $\begingroup$ That is correct, and a phenomenon that occurs because $p=0.5$ specifically yields the same score for both heads and tails. Once you look at other predictions $p$, you will find that $p=.5$ is much less consistent with 95 heads and 5 tails. This is why proper scoring rules are typically used to compare competing predictions, not to assess whether one set of predictions is true. (The null hypothesis is very rarely exactly true, so null hypothesis significance testing really turns into the question "do we have enough data to detect the differences we know are there?"). $\endgroup$ Commented Mar 27 at 8:01

Your Answer

By clicking “Post Your Answer”, you agree to our terms of service and acknowledge you have read our privacy policy.

Not the answer you're looking for? Browse other questions tagged or ask your own question.