I have created a model with a three way interaction, analyzing how taste of bread (fr2) decreases over time (time2), and how skill of the baker (skill2) impacts longevity of taste, across different types of bread (type), among bread baskets (id) nested since they're made with correlated ingredients;
full_model <- lmer(fr2 ~ time2 * skill2 * type + (1|id), REML = F, data = data_long)
fr2 - continuous (taste)
time2 - continuous (days)
skill2 - continuous (0,1,2,3)
type - categorical (1:10)
sweet - binary (0:1)
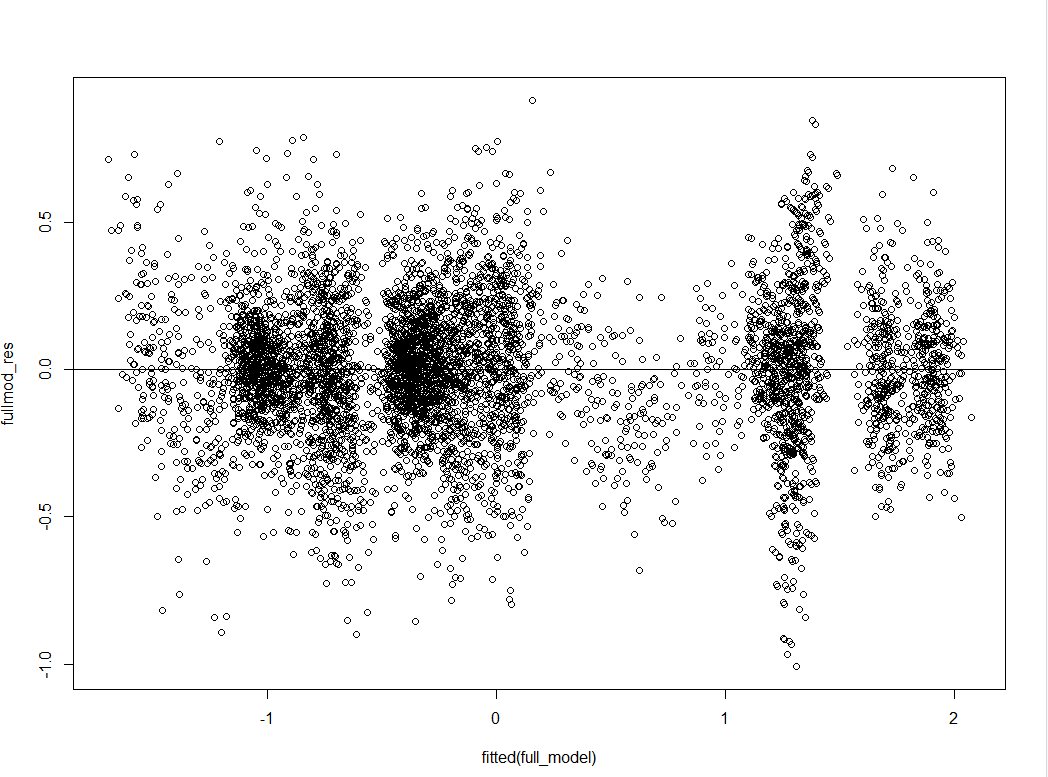
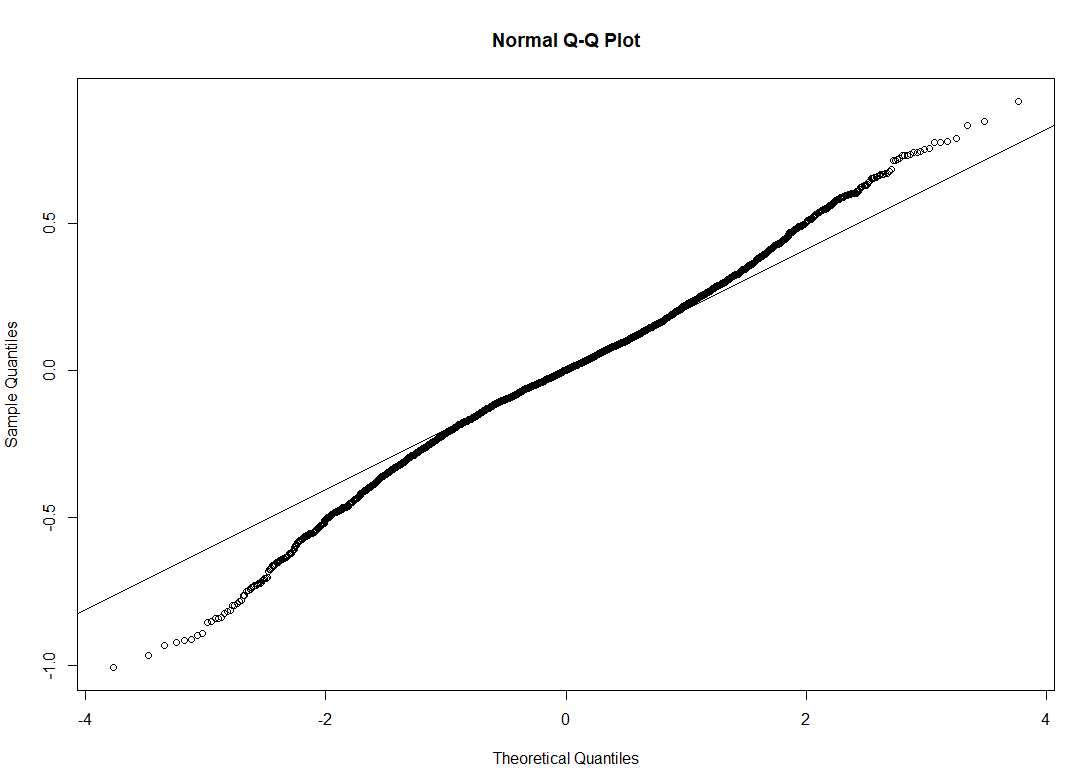
The three way interaction is giving expected significant results (emtrends) when evaluating bread types where skill has a large impact on taste over time. However, when I plot the residuals against the fitted values, there is a lot of clustering along the fitted values. I imagine this is because different types of bread have many ranges of taste, some between 30-40, and others between 50-60. When I plot models separately by type of bread, the residuals are much more evenly spread.
I attempted to log transform, center, and standardize the taste, time, and skill variables, but still continue to have clustering. Should I be concerned using this model to infer the significance of interactions and contrasts between different types of bread?
Here is the data, which is fabricated: https://github.com/GreenJumper/bread/blob/71cf99a481dfe96632ad62e9afec1960a7ec3308/data_long.csv
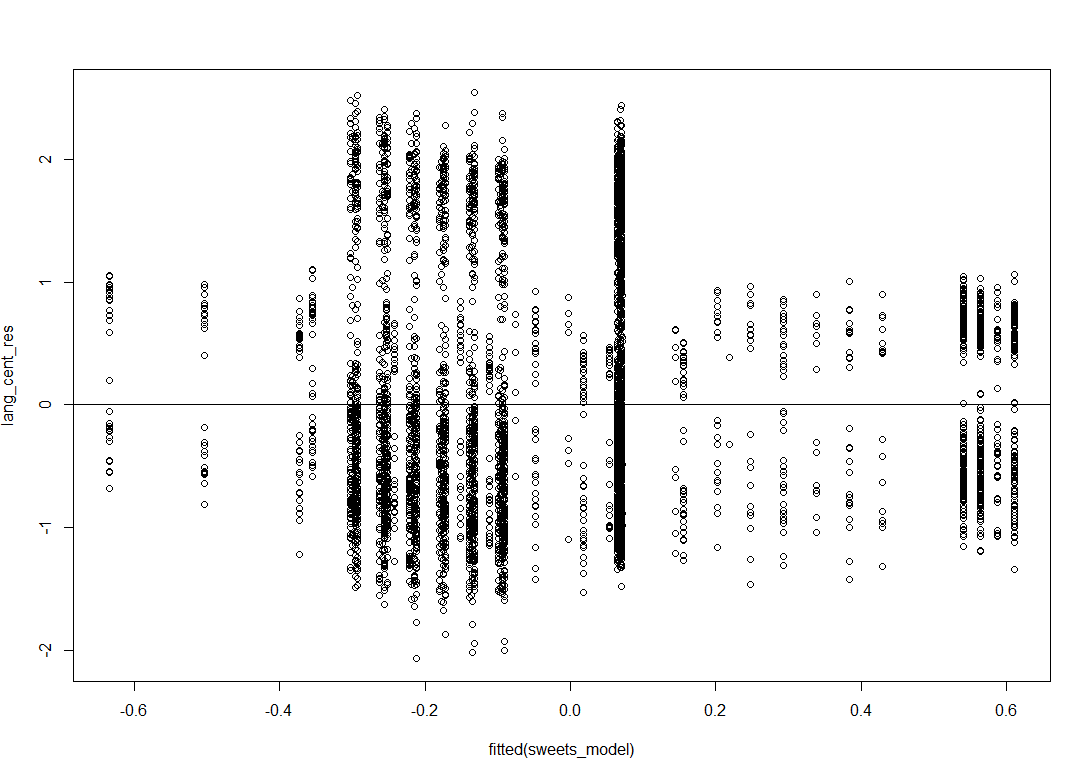
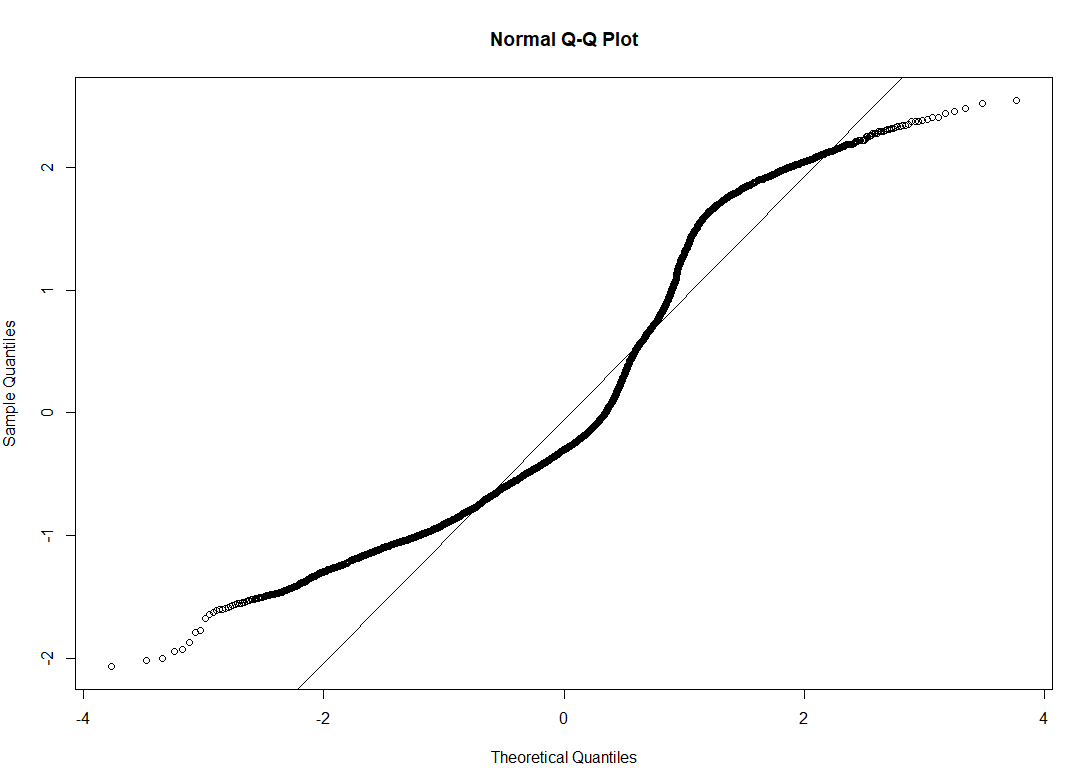
I would also like to separate the bread types into two categories as a binary variable (sweet/unsweet). I intentionally altered the data so that sweet breads (bread types 2 and 5) have higher longevity when baker's skill is high (strong interaction). When I try to model this, the residuals are also a bit funky, and the residuals don't look normal in the qqplot. Any ideas on how I could adjust the model?
Any help would be greatly appreciated. Thanks!
sweets_model <- lmer(fr2 ~ skill2 * time2 * sweets + (1|id), REML = F, data = data_long)


