1
$\begingroup$

I have a set of product online reviews data. The dataset contains review text and 1-5 star ratings.

I've extracted 5 prevalence topics using R stm package. They are price, design, packaging, promotion strategies, and varieties. I also divided reviews into three sentiment groups based on the star ratings: 1- and 2-star ratings were classified as "negative", 3-star ratings were "neutral", and 4- and 5-star ratings were "positive".

Now I would like to graphically present topical prevalence across sentiment groups. That is for example, a graph showing that the topic "price" is largely associated with "negative" sentiment while "design" is positively discussed.

Any suggestions for this task?

Edit: Is it possible to present the data like the graphic below (extracted from the paper: stm: R Package for Structural Topic Models)

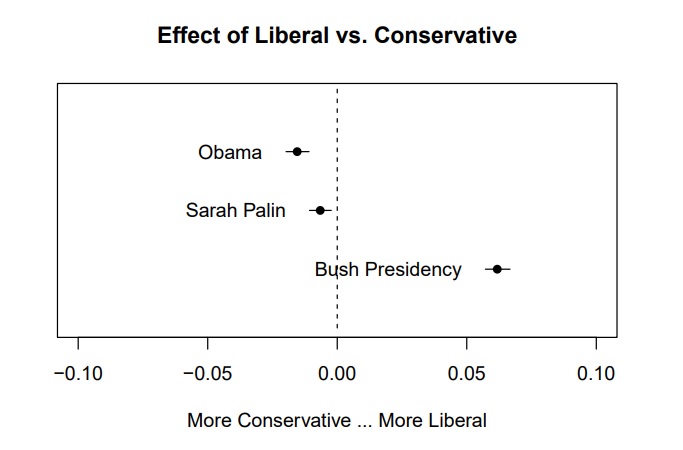
enter image description here

$\endgroup$
3
  • 1
    $\begingroup$ How about keeping the original 5 ratings and using a stacked bar chart with a diverging color palette? $\endgroup$ Commented Jul 17 at 15:14
  • $\begingroup$ Try looking into radius charts, star charts, and certain types of cobweb diagrams such as described in the Oxford Dictionary of Statistics or at researchgate.net/profile/Anubhav-Pratap-Singh/publication/… $\endgroup$
    – rolando2
    Commented Jul 17 at 15:20
  • $\begingroup$ @rolando2 suggestion is good! Will try. Ps. I have edited the question and make it clearer for what I would like the result to be like. $\endgroup$
    – James
    Commented Jul 18 at 9:01

0

Your Answer

By clicking “Post Your Answer”, you agree to our terms of service and acknowledge you have read our privacy policy.

Browse other questions tagged or ask your own question.