In more-or-less reverse order:
Robust estimates in this context only affect the (co)variances of the coefficient estimates. There should be no effect on the scaled Schoenfeld residual plots.
There are two types of "reference values" involved here. One is the (set of) reference values for the covariate itself (age). The other is the reference value for the plot of scaled Schoenfeld residuals.
With respect to age itself, think about an age "reference value" at each event time. At each event time the calculation starts with the event-risk-weighted average of a covariate's values among all those then at risk. That's what I think of as the "reference value" for that covariate at that event time. The unscaled Schoenfeld residual for the individual having the event at that time is the difference between that individual's covariate value and the risk-weighted average at that time; it's then scaled based on the variances of covariate values.
For a predictor involved in multiple terms of the model the calculation is done for each term associated with the predictor; for pspline(age,df=4) in your reproducible example there are 14 such basis-function terms. You can see that by displaying the matrix of residuals: head(residuals(mfit, type="scaledsch")). With the way that you invoked cox.zph(), that function combines information from all of the basis-function terms, performs a score test using the total degrees of freedom associated with age, and returns the scaled Schoenfeld residuals combined over all the basis functions associated with pspline(age,df=4).
The "reference value" for the scaled Schoenfeld residuals (only relevant for the plots, not the score test) depends on whether it is for a single coefficient or a residual combined over multiple coefficients.
For a single coefficient you can think of the overall coefficient estimate from the Cox model as the "reference value" to which the individual residuals are added to produce the plot. That's an estimate of the time-varying coefficient itself, as explained on this page.
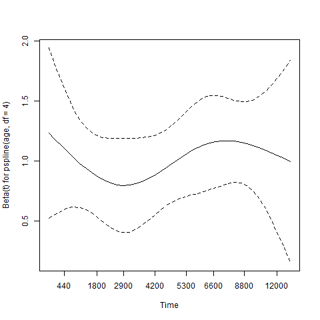
With residuals combined over multiple coefficients for a predictor, the software just adds 1 to the combined residual value. I suppose you could think of the "reference value" in that case as a value of 1. What you see in the plot in that case is thus the shape of the change in the overall association of the predictor with outcome over time rather than the actual coefficient over time. That shape applies to the entire association between age and outcome; it isn't specific to any particular value of age.
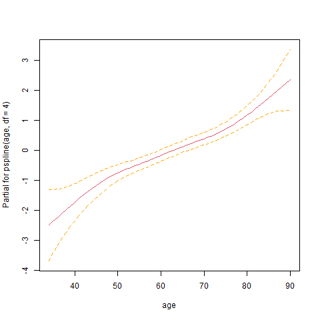
Again, you can see that in your reproducible example: the plot(zph[2], resid = FALSE) output is centered around a value of 1, while the coefficient for the linear term in age, which dominates the non-linear terms in that case, is 0.06682. Compare that plot against what you would get with a simple linear term for age.
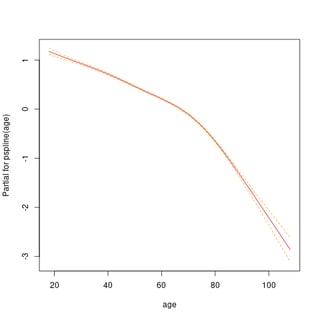
The termplot() shows the overall nonlinear association between the predictor (age here) and outcome if the proportional hazards (PH) assumption holds. When PH doesn't hold it represents a type of event-averaged coefficient, as explained on this page.
I don't know of any simple way to think about individual basis functions and coefficients that come from pspline(). What's important is how they all work together to model the (potentially event-averaged) nonlinear association between age and outcome. I would not recommend paying attention to the basis functions individually (for PH or anything else).
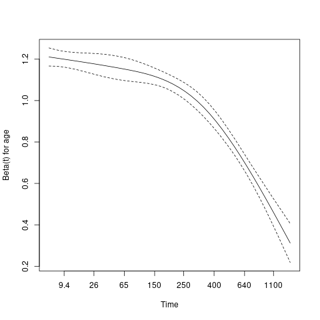
The seemingly similar shape of the termplot() and plot.cox.zph() displays from your "real model" is probably a coincidence, based on the nature of your study.
The "event" is evidently "misuse of a given prescription drug." Unlike death events, whose risks typically increase with age and for which a termplot() output would tend to be increasing with age, the drop with age in your termplot() output suggests that a drug "misuse" event is more likely at younger than at older ages. That makes sense, at least based on what I've learned about substance abuse over the years. Remember, when PH doesn't hold, the termplot() is displaying a type of event-averaged association with age.
The drop in the plot.cox.zph() output with time means something different. It means that the overall association between age and outcome is strongest at times soon after your time = 0 reference (however that was defined in your study) and decreases thereafter. One possibility, again consistent with my personal observations, is that some people are more likely (for biological/social reasons) to misuse drugs and such individuals might thus be expected to misuse early on rather than later. There are other considerations, for example whether there is still ready access to the drugs at later time points for all individuals and whether there might be some informative censoring in your study design, which I outlined in this answer.


