I have 4 sets of random floats between [0,1]: $d1, d2, d3, d4$. I need to compare these sets by pairs and I make use of the kde.test function of R's ks package to do so.
When I use kde.test to obtain the pvalue of distributions $d1,d2$ I get a value of ~0.55, but if I do the same for $d3,d4$ I get ~0.00.
Here's the code I use in R to come up with those values:
d1 <- c(...)
d2 <- c(...)
pv12 <- kde.test(x1=d1, x2=d2)$pvalue

d3 <- c(...)
d4 <- c(...)
pv34 <- kde.test(x1=d3, x4=d2)$pvalue
The complete $d1,d2,d3,d4$ sets are here and their lengths are: len(d1) = 20, len(d2) = 210, len(d3) = 200, len(d4) = 2100.
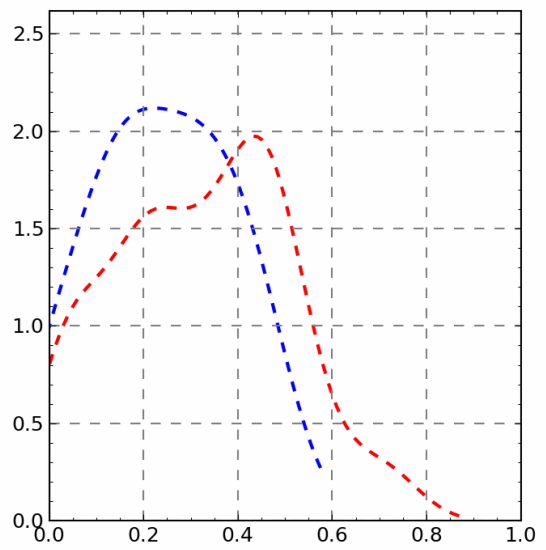
Sets $d1,d2$ have fewer elements than $d3,d4$ but the shapes of the KDEs are similar. Here's the KDEs for $d1,d2$ (blue and red respectively):

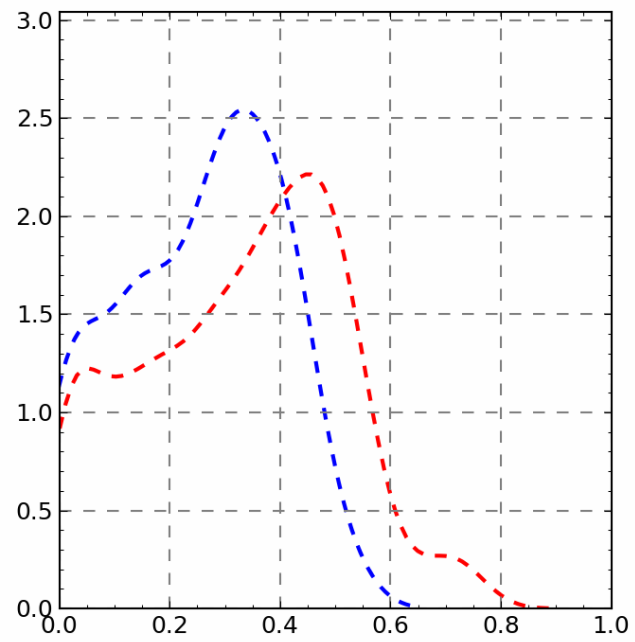
and here's the KDEs for $d3,d4$ (blue and red respectively):

Because of the similarity of the KDEs I would have expected somewhat similar pvalues but the results I get are wildly different.
I'm either not understanding what the kde.test does or what the resulting pvalues means (or both).
Could someone explain what is happening and why my expectations are no correct?
Add
I get very similar results if I apply the Kolmogorov-Smirnov test from the scipy.stats.ks_2samp package which also gives a p-value as output.
