0
$\begingroup$

I'm trying some metrics to filter a list of gene names with associated numerical values which correspond to their abundance.

I'm looking for some interesting genes and trying to see if they come up to the top region of the ranked gene list (ranked by abundance) before and after filtering. Please see Fig. enclosed. enter image description here
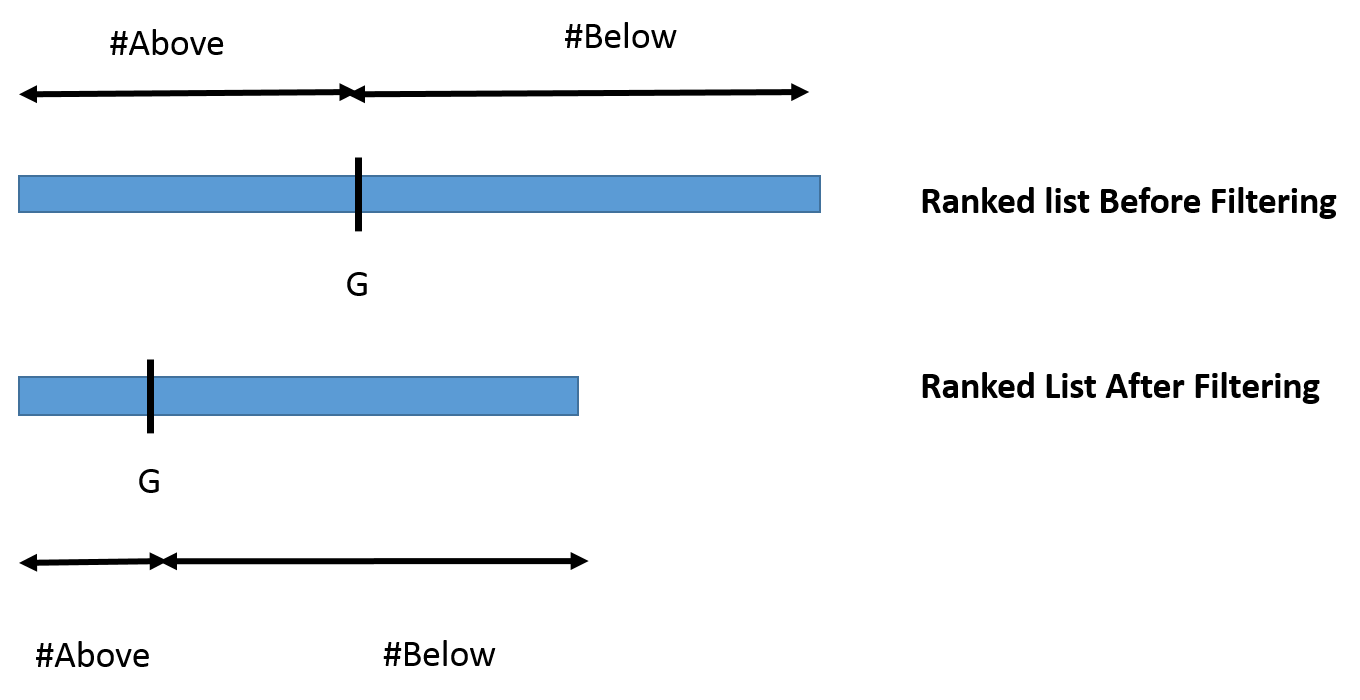
I wish to see if the ranking of my gene of interest (G) has changed significantly before and after filtering and I'm thinking to do a Fisher's Exact test for proportions to ascertain the significance.

So given the rank of the gene of interest I'm willing to look at the number of genes above and below the gene in rank with and without the filtering and compare their proportions using FE Test

If in the UN-Filtered data there are 200 and 2800 genes above and below G and 30 and 100 in the Filtered data respectively then I can do the FE test as follows (in R):

>my.mat <- matrix(c(30,100,200,2800),nrow=2,byrow=TRUE)
>my.mat
     [,1] [,2]
[1,]   30  100
[2,]  200 2800

>fisher.test(my.mat,alternative="two.sided") 

Please let me know whether I can do a Fisher Exact test AT ALL for such kind of measurement ?

Thanks in advance

$\endgroup$
1
  • $\begingroup$ And for the Fisher's test shall I use the "two.sided" option? $\endgroup$
    – The August
    Commented Feb 14, 2014 at 17:00

1 Answer 1

3
$\begingroup$

Your problem suffers from two main drawbacks which advocate against the usage of Fisher's Exact test.

  • The dependence between the two cases for which you want to see the difference (same genes, pre- and post-filtering)
  • The fact that the number of observations in the contigency table are quite unbalanced (a large number of genes is excluded after data filtering)

Although in practice there shouldn't be a great difference if a significant result is out there, such issues might render the Fisher's Exact test unstable. What you could use instead, is the hypergeometric test or the McNemar's test for 2x2 contingency tables. For details regarding the two, if you do a google search, you can find many thorough articles describing them. Regarding the hypergeomtric test and gene set enrichment analysis, you will find that it is mainly applied for Gene Ontology. However, the setting described here is not much different.

Regarding the application of the hypergeometric test, if we assume that the un-filtered set is the "reference" set and the filtered test is the "significant" test and if we classify as "successes" the genes that are above the rank, let n and x be the numbers of genes below and above the rank in the unfiltered list respectively and t and z the same numbers in the filtered list. Then, the probability of your rank being "different" in the two sets (in Gene Ontology analysis literature, you will find this as "over-representation") is given by:

$$1-P_{hypergeometric}(Z<z)= 1- \sum_{z=0}^t\frac{{t \choose z}{n \choose x}}{{n+t \choose z+x}} $$

In R:

p <- 1 - phyper(30,200,2800,30+100)

which is similar (in terms of significance) to the value you get by your code but to my opinion more accurate.

Regarding the McNemar test, you can also try it in R (it is already in the stats package:

mcnemar.test(my.mat)
$\endgroup$
1
  • 1
    $\begingroup$ The Liddell's exact test is an exact alternative to McNemar's test. $\endgroup$ Commented Feb 13, 2014 at 10:30

Your Answer

By clicking “Post Your Answer”, you agree to our terms of service and acknowledge you have read our privacy policy.

Not the answer you're looking for? Browse other questions tagged or ask your own question.