6
$\begingroup$

I'm reading Fawcett's 2004 paper on ROC graphs for machine learning algorithms, which can be found here.

On page 7-8 he shows a simple ROC example and makes some interpretations that I don't understand. Below is the ROC graph:
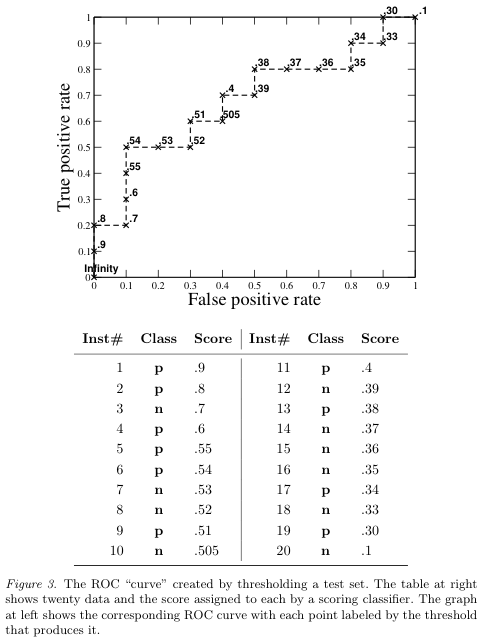
example ROC graph

And here is what he wrote:

Although the test set is very small, we can make some tentative observations about the classifier. It appears to perform better in the more conservative region of the graph; the ROC point at (0.1,0.5) produces its highest accuracy (70%). This is equivalent to saying that the classifier is better at identifying likely positives than at identifying likely negatives. Note also that the classifier’s best accuracy occurs at a threshold of ≥ .54, rather than at ≥ .5 as we might expect with a balanced distribution.

I don't understand how he derived his interpretations.

  1. the ROC point at (0.1,0.5) produces its highest accuracy (70%) How is the highest accuracy of 70% for point (0.1, 0.5) found from that graph, and how do we know it's the highest accuracy?

  2. This is equivalent to saying that the classifier is better at identifying likely positives than at identifying likely negatives. I don't see how that interpretation is determined.

  3. Note also that the classifier’s best accuracy occurs at a threshold of ≥ .54 How was this found?

  4. rather than at ≥ .5 as we might expect with a balanced distribution Why would we expect that?

Thank you for any help.

$\endgroup$
0

2 Answers 2

6
$\begingroup$
  1. The accuracy is the ratio of correct results (true positives and true negatives) to total number of tests. If you classify the first six results in the table are "positive" and the rest are "negative", that gives 5 true positives and 9 true negatives. The accuracy is 14/20, which is higher than any other threshold point on the curve.

  2. If you use this classification rule, 5/6 of the data you classify as "positive" are correct, but only 9/14 of those you classify as "negative" are really negative. Seeing an observation classified as "positive" is more trustworthy than seeing a "negative" classification.

  3. A decision rule that classifies scores $\geq .54$ as "positive" is the threshold that chooses the top 6 scores in this sample.

  4. A balanced distribution of the score would imply that true negatives get high scores just as often as true positives get low scores. And in this example it looks like we're assuming that the proportions are .50-.50 positive and negative.

$\endgroup$
2
  • $\begingroup$ Thanks. For 1, how do you know to only look at the first six results to be positive? Why not the first 8 or 9? For 2, how do you get "The accuracy is 14/20, which is higher than any other threshold point on the curve"? What is a threshold point? Is it when you go from upwards to rightwards? And do you have to try out all such points to find the max accuracy? $\endgroup$ Commented Feb 17, 2014 at 22:57
  • $\begingroup$ I'm referring to a threshold for the scores in the 3rd and 6th columns of the table. A classifier means picking a number and calling all scores higher than that "positive" and all lower scores "negative". Numbers 7 and 8 are truly negative, so if you lower the threshold to class them as "positive" you'll get two fewer correct decisions. A threshold of .5 gives 5 true positive and 5 true negative for accuracy 10/20=.5, not great. $\endgroup$
    – vafisher
    Commented Feb 17, 2014 at 23:01
0
$\begingroup$

My understanding is that these are not mathematical assessments. One way to get a best point on the curve is to find the one most protruding in the 10:45 clock direction. But that's assuming you care about fpr equally as tpr, which is not always the case. All subsequent statements are based on this choice.

$\endgroup$

Your Answer

By clicking “Post Your Answer”, you agree to our terms of service and acknowledge you have read our privacy policy.

Not the answer you're looking for? Browse other questions tagged or ask your own question.