4
$\begingroup$

I have a basic understanding of basic statistics, but I believe I've gotten myself out of my depth.

I have a data set with a dependent variable (time span) and three quantitative independent variables. There is also a qualitative independent variable (a type flag) but I think I can quantify it if I must. The quantitative independent variables all seem to be inversely proportional to the dependent variable.

I want to see if I can determine which of these independent variables has the most influence over the dependent. I ran all data through regression tests using statsmodels for Python (ordinary least squares) but I get warnings indicating multicollinearity and $R^2 = 0.002$. I've also tried univariate linear regression of each independent but am not getting something that looks usable.

Finally, I also have this problem of the qualitative independent.

Again, I'd really like to know how these independents work together to influence the dependent, and I'd also like to know the degrees to which they influence but I'm clearly lost as to the methodology.

EDIT

Warnings:

1 The condition number is large, 5.65e+06. This might indicate that there are strong multicollinearity or other numerical problems.

Screenshot of full output from .fit().summary()
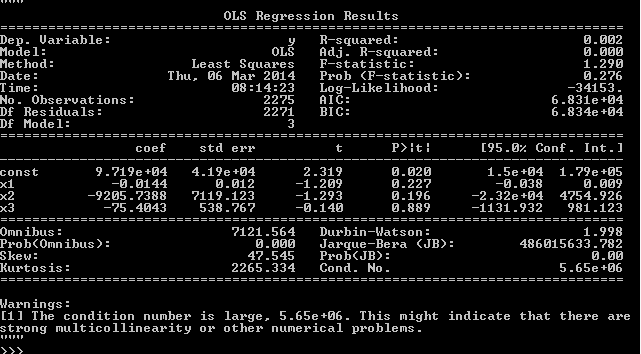
summary

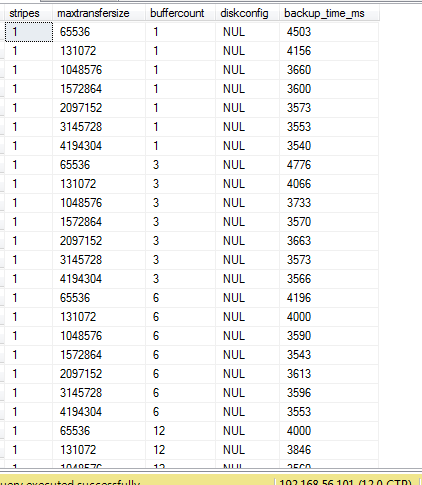
Data Profile:

enter image description here

I should also note that two of these independent variables (maxtransfersize and buffercount) repeat for every combination of stripes and diskconfig (<- this is the qualitative variable, and I think I have a way of quantifying that now). backup_time_ms is the dependent variable.

$\endgroup$
1
  • 1
    $\begingroup$ Post your warning text in full. Can you display a snapshot of the data set (Probably just a few observations). Post the output of statsmodel that shows the $R^2R $\endgroup$ Commented Mar 6, 2014 at 14:16

2 Answers 2

3
$\begingroup$

The problem that you're running into is the multi-collinearity in the input matrix for your regression. the matrix is 'ill-conditioned', meaning that small errors in the input lead to large errors in the ouput. The calculation for the condition number of a matrix is $\frac{\lambda_{max}}{\lambda_{min}}$ (that might only be for symmetric matricies), or the ratio of the largest to the smallest eigenvalue of the matrix.. I think that the general formula is $||A|| ||A^{-1}||$ The normal equations (the equation used to solve for the betas of the regression) are $\beta = (A^TA)^{-1}Ay$. So as you can see, if you have a matrix with a large condition number (which your program is telling you that you do), it becomes worse from the normal equations since you basically multiply the A matrix together three times. This problem (the multi-collinearity) is what's causing your $R^2$ and your betas to have "messed up" values. (remember that small errors in the inputs lead to large errors in the output). Now, what can you do about this? This large condition number comes up also on very high dimensional data. For you, it seems to be coming from the fact that your predictor variables are strongly related. What can you do about this?

(1) You can figure out which of your variables is causing the problem and remove it from the model.

(2) You can consider methods like ridge regression.

What does ridge regression do? They add a small perturbation to your matrix ($\lambda I)$ where $\lambda$ is the perturbation, and I is an identity matrix (matrix with zeroes everywhere, but ones in the diagonal). This reduces your problem with multi-collinearity, but at the expense of adding some bias to the model. I'd suggest on reading up on ridge regression or lasso before just jumping in. I've always found "The Elements of Statistical Learning" to be a good reference. It's free as a pdf online. Good luck.

$\endgroup$
3
  • $\begingroup$ (1) The r-squared is low. This is secondary to collinearity? (2) the lasso performs well in the setting of collinearity? (3) Lasso is a traditional way to manage colinearity? Usually one (a) removing variable (b) combines variables (c) orthogolonizing (sp?) stats.stackexchange.com/questions/25611/… $\endgroup$
    – charles
    Commented Mar 6, 2014 at 19:47
  • $\begingroup$ (c) yes, i think it's called gram-schmidt. $\endgroup$ Commented Mar 6, 2014 at 19:58
  • $\begingroup$ Hi there. Thanks for the feedback. I apologize for the delay. I'm no good at these advanced statistical methods and am really just trying to determine which of x1, x2, and x3 holds the most influence over the outcome. I'm trying to understand the methods you've described (thanks for the paper) but I think that I am just having a hard time conceptualizing how to analyze my data set. $\endgroup$
    – swasheck
    Commented Mar 19, 2014 at 1:41
1
$\begingroup$

There is a lot to comment on here. Not sure what is the most useful.

(0) I've also tried univariate linear regression of each independent but am not getting something that looks usable If there isn't a strong association, statistics won't solve that. Exploratory data analysis with graphs can be useful here.
(1) dependent variable (time span) Time variables: these can be tricky. They are often not normally distributed. You may want to examine this assumption
(2) quantitative qualitative independent variable This isn't useful terminology. Continuous or categorical. And if you think that there isn't a linear relationship for continuous variables (as discovered in exploratory analysis), how you plan to accommodate that would be a better start
(3) X2 and X3 appear to be correlated based on regression. Are they? Exploratory analysis with X2 vs X3 plot would be useful.

$\endgroup$
1
  • $\begingroup$ Thanks for your feedback and I apologize for the delay. As for (3), I don't know how to answer that because they were both controlled by me when creating the test. I established the test such that x2 and x3 were held constant while x1 was changed. Then I held x1 and x3 constant while x2 was changed. Finally, I held x1 and x2 constant while x3 was changed. As I said, I'm really not particularly good with statistics, but what I'd really like to know is which of these variable holds the most influence over the result and I just don't know how to achieve that. $\endgroup$
    – swasheck
    Commented Mar 19, 2014 at 1:27

Your Answer

By clicking “Post Your Answer”, you agree to our terms of service and acknowledge you have read our privacy policy.

Not the answer you're looking for? Browse other questions tagged or ask your own question.