3
$\begingroup$

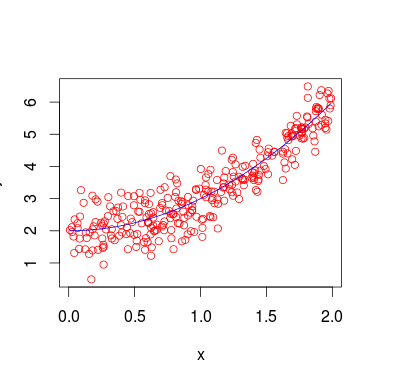
I'm using R to fit a neural network to data generated by the formula $y = x^2 + \frac{\epsilon}{2}$ where $x \sim \mathcal{U}(0, 2)$ and $\epsilon \sim N(0, 1)$ (very simple, right?). The following plot shows the plot of function $x^2$ and the generated data: 1
Now, I take the average error for $10$ runs for a Neural Network model of size $k$ for all $k \in \{1, \ldots, 50\}$ getting the following plot: 2
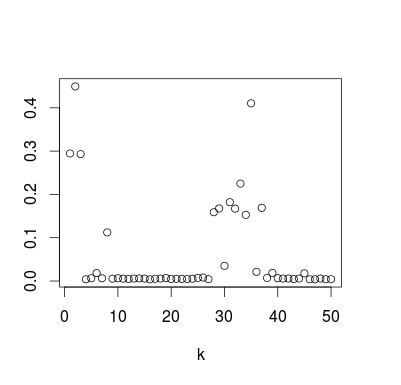
What I find rather strange is that from ~$10$ to ~$30$ and from ~$40$ to ~$50$ it is $\approx 0$ and stable but from ~$30$ to ~$40$ it is volatile and $>> 0$. I've also tried several other functions getting the same effect. Is that normal? Can you provide an explanation for it?

The plot above was generated by the following R code:

require(nnet)

f<-function(x) 2 + x^2

error <- rep(0, 50)

for (k in 1:50) {
  for (z in 1:10) {
    x<-sort(runif(300,0,2))
    fx <- f(x)
    y<-fx + 0.5*rnorm(300)
    d<-data.frame(x,y)
    names(d)<-c("X","Y")

    n<-nnet(Y~X,size=k,linout=T,data=d,maxit=40)
    pn<-predict(n,d)

    error[k] = error[k] + mean((fx - pn)^2)
  }
  error[k] = error[k] / 10
  plot(error, xlab = "k", ylab = "Error")
}
$\endgroup$

1 Answer 1

1
$\begingroup$

This appears to be a problem of some iterations overfitting the data, so there are sporadically some models which don't predict the noiseless target well. In this line error[k] = error[k] + mean((fx - pn)^2), you're measuring the mean square error against the data without noise. However, the model was fit to data that includes noise, so sometimes the model is reproducing the noise.

This code modifies your code to (1) add a tiny amount of weight decay (decay=1e-3) as a hedge against overfitting and (2) measure the in-sample training error relative to the noisy data.

set.seed(1337)
f<-function(x) 2 + x^2

error <- rep(0, 50)

for (k in 1:50) {
  for (z in 1:10) {
    x<-sort(runif(300,0,2))
    fx <- f(x)
    y<-fx + 0.5*rnorm(300)
    d<-data.frame(x,y)
    names(d)<-c("X","Y")

    n<-nnet(Y~X,size=k,linout=T,data=d,maxit=100, decay=1e-3)
    pn<-predict(n,d)

    error[k] = error[k] + mean((y - pn)^2)
  }
  error[k] = error[k] / 10
  plot(error, xlab = "k", ylab = "Error", ylim=c(0,1))
}

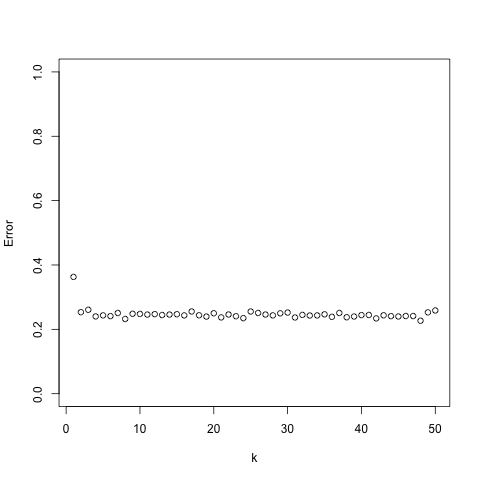
This plot shows that the phenomenon you observed -- some selections of k do not perform well -- is not present. Note that k=1 has the highest error; this corresponds to a single logistic neuron, which clearly is incapable of modeling a quadratic relation to a high degree of precision.

enter image description here

(The reason that the error is higher is that this code uses y, which has noise added.)

$\endgroup$

Your Answer

By clicking “Post Your Answer”, you agree to our terms of service and acknowledge you have read our privacy policy.

Not the answer you're looking for? Browse other questions tagged or ask your own question.