4
$\begingroup$

Based on three datasets, I have produced the scatterplot below in Python: enter image description here
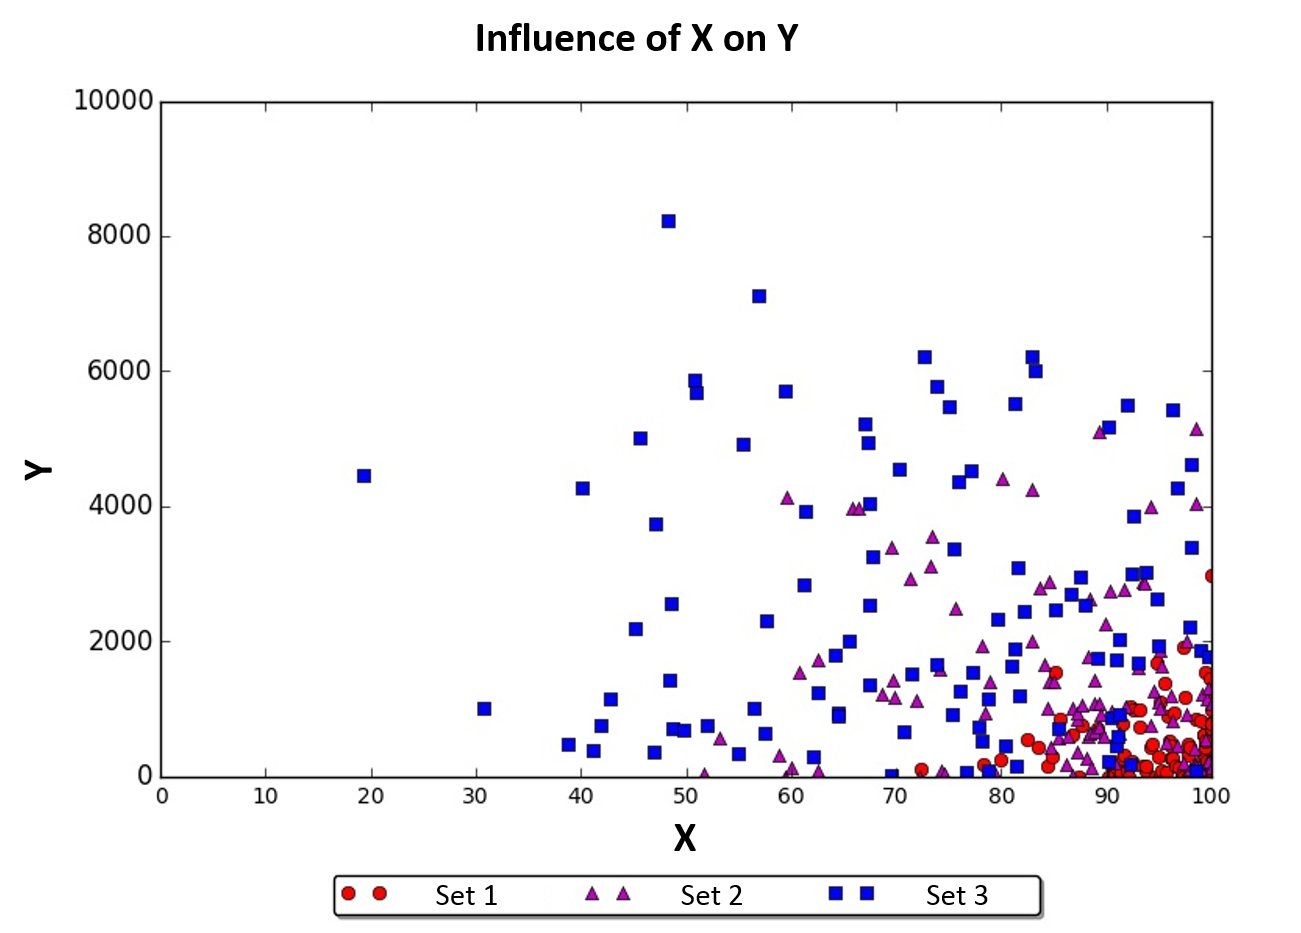
I am trying to fit a line on each dataset, but when I check the metrics this is what I get:

  • Set 1 (red): $R^2$=0.002, p-value=0.651
  • Set 2 (purple): $R^2$=0.008, p-value=0.378
  • Set 3 (blue): $R squared$=0.001, p-value=0.714

My question: are such data sets impossible to fit? Is there any kind of data transformation I could apply, based on the scatterplot shape?

My Values (red dataset):

X       Y
72.3    109
78.34   169
80      239
82.4    550
83.49   429
84.34   162
84.78   285
85.18   1553
85.58   852
86.73   611
87.34   0
87.65   764
89.09   710
90.18   0
90.49   155
90.66   2
90.73   42
90.75   162
91.23   0
91.31   57
91.51   275
91.58   771
91.73   324
91.93   78
92.1    0
92.22   1023
92.36   223
92.49   981
93.17   978
93.17   744
93.47   162
93.75   76
93.8    163
94.12   433
94.27   472
94.59   0
94.73   1689
94.87   302
95.05   0
95.09   1100
95.26   73
95.49   1370
95.69   72
95.84   890
96.02   529
96.07   273
96.08   458
96.23   281
96.42   933
96.52   149
96.93   135
97.21   7
97.36   1912
97.38   0
97.5    1169
97.72   0
97.77   314
97.81   475
97.91   436
98.25   56
98.33   5
98.36   0
98.43   135
98.45   81
98.46   849
98.79   20
98.91   818
98.91   58
99.11   244
99.21   348
99.28   621
99.29   618
99.34   430
99.4    513
99.41   49
99.43   1543
99.46   23
99.46   62
99.57   178
99.58   50
99.58   221
99.78   179
99.83   1446
99.94   1249
99.94   9
99.94   7
99.94   10
99.97   0
99.98   228
99.99   111
99.99   711
100     976
100     2980
100     72
100     1
100     24
100     698
100     803
100     774
100     0
$\endgroup$
11
  • 2
    $\begingroup$ What do the variables measure? e.g. are the x's percentages? $\endgroup$
    – Glen_b
    Commented Nov 30, 2015 at 11:46
  • 2
    $\begingroup$ Can you show the data? $\endgroup$
    – Nick Cox
    Commented Nov 30, 2015 at 11:51
  • 1
    $\begingroup$ You could copy and paste into your question. Any code that lists the values, e.g. comma-separated, will probably be easily adaptable to most programs people might use. $\endgroup$
    – Nick Cox
    Commented Nov 30, 2015 at 12:13
  • 2
    $\begingroup$ @KarstenW I guess that log scale for percent will not help here, as the values pile up near 100. $\endgroup$
    – Nick Cox
    Commented Nov 30, 2015 at 12:14
  • 2
    $\begingroup$ Thanks for giving X and Y. How do the three sets come in here? At first sight the posted data are just set 1. $\endgroup$
    – Nick Cox
    Commented Nov 30, 2015 at 12:26

2 Answers 2

11
$\begingroup$

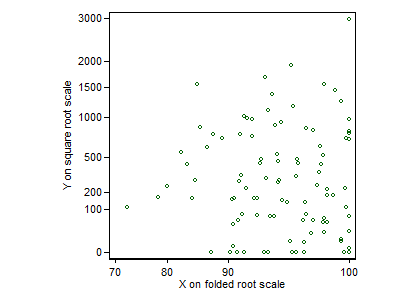
With data like these (indeed almost any data) the first step is a graphic that really helps to see what is going on. Crowding of data points on default scales makes that difficult to achieve.

The occurrence of exact zeros on $Y$ inhibits logarithmic transformation. Some would add a constant first to get round that. I would suggest here a square root scale instead.

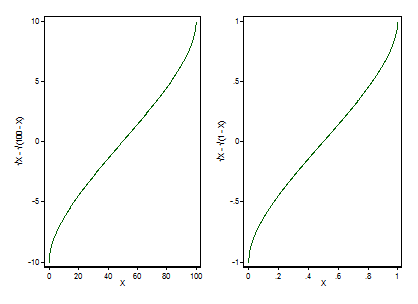
Similarly, but not identically, the occurrence of exact $100$%s inhibits logit transformation of $X$, which is a kind of default for fractions not equal to zero or unity. I would suggest here a folded root transformation, $\root \of X - \root \of {100 - X}$ for the percents, which stretches out the high percents. (See, e.g., Tukey, J.W. 1977. Exploratory Data Analysis. Reading, MA: Addison-Wesley.)

Here's a graph for set 1 only (all posted at the time of writing). I have used transformed scales, but labelled in terms of the original values. I have to say that I see no structure here, so the essentially flat regression line does seem unsurprising.

enter image description here

EDIT It may be reassuring to people unfamiliar with this transformation to see how it works. Folding means that the transformation is symmetric around the middle of the range. The transformation is conservative insofar as it affects shape of relationship minimally, except for values near $0$ and $100$%, which are stretched out. (The curvature is useful in this example for values between about $70$ and $100$%.) A small but often useful virtue is that the transformation is defined for exact zeros and $100$s. Apart from a trivial prefactor, $\root \of X - \root \of {1 - X}$ behaves identically for $X$ now defined as proportions or fractions between $0$ and $1$.

enter image description here

$\endgroup$
3
  • 1
    $\begingroup$ They are just plots of the functions, just as you might plot $\ln X$ versus $X$. $\endgroup$
    – Nick Cox
    Commented Nov 30, 2015 at 20:22
  • $\begingroup$ You seem to know a lot about transformations and I like this thing, so here is a question for you. Suppose my dataset had a structure that was visible only after the folded root was applied. Would R squared have increased after having adopted this transformation, in an attempt to unravel hidden or non-visible patterns? Would the same happen to the p-values? $\endgroup$
    – FaCoffee
    Commented Nov 30, 2015 at 20:25
  • $\begingroup$ Sorry, I really can't predict that in general, not least because the models implied are quite different. But for the data you have posted, for set 1 only, regression of $Y$ on $X$ gives a $P$-value of 0.651 while for the transformations used it is 0.913. If anything, the transformations make it easier to see what is going on, which is that nothing much is going on. At the same time, it's a toss-up between two versions of the same data with not much that is clear either way. Only you know whether there is some substantive story here, or indeed other predictors to help. $\endgroup$
    – Nick Cox
    Commented Nov 30, 2015 at 20:34
4
$\begingroup$

First, no data set is impossible to fit - in fact, you've already produced some fits, just not very good ones.

Second, because you've put all three data sets in the same image, it's hard to see any relationship that might exist in the red and purple data sets, since the $X$ values are all quite high compared to the red data set.

Third, eyeballing the data values you gave for the red data set, it looks like the $Y$ values are all non-negative integers, with quite a few 0's. This makes me think of zero-inflated negative binomial models.

Fourth, from eyeballing the blue data set, I am very surprised that the $R^2$ is essentially 0. Are you sure your code is right? Could you post the code? I'd also try taking log of $Y$ only. In addition, you seem to have some outliers, so you could try robust regression or quantile regression.

$\endgroup$
2
  • 1
    $\begingroup$ Thank you for your insights. The blue data set is appalling to me as well, but I can confirm, if Excel is anything to go by: the blue R squared is 0.0014. So I assume there is no mistake in the code I am using - which is, by the way, a Python built-in function called stats.linregress(x,y). $\endgroup$
    – FaCoffee
    Commented Nov 30, 2015 at 12:42
  • 2
    $\begingroup$ As now explicit in the data posting, and as discussed in my answer, there are exact zeros on $Y$. $\endgroup$
    – Nick Cox
    Commented Nov 30, 2015 at 12:48

Your Answer

By clicking “Post Your Answer”, you agree to our terms of service and acknowledge you have read our privacy policy.

Not the answer you're looking for? Browse other questions tagged or ask your own question.