2
$\begingroup$

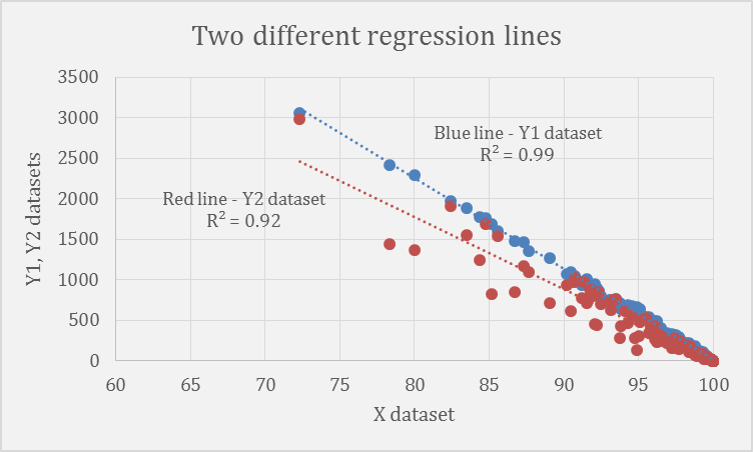
I have three datasets, let's call them X and Y1 and Y2. A scatterplot is produced out of them, with Y1 and Y2 sharing them same X dataset.

My question: if the two regression lines are different in both slope and intercept, is there a way to evaluate if the X dataset has more influence on Y1 or Y2?

Based on the image below, this is to say - which Y dataset is more influenced by the X dataset?
Is there any metrics for measuring this?

  • Blue slope (Y1): -112
  • Red slope (Y2): -90

Image: enter image description here

$\endgroup$
11
  • $\begingroup$ When x=100 must y be 0? $\endgroup$
    – Glen_b
    Commented Dec 2, 2015 at 11:03
  • 1
    $\begingroup$ Let's focus on (ii) to begin with because that impacts the other two. If x=100 implies y=0, then the relationship is constrained to go through (100,0) and you only have one free parameter. If we consider $x_2=100-x$ then it's effectively regression through the origin in the new variable (i.e. your model for the relationship is actually $E(y)=b (100-x)$). Are you just fitting plain two-parameter linear regression with equal weight to all data points? $\endgroup$
    – Glen_b
    Commented Dec 2, 2015 at 11:36
  • 1
    $\begingroup$ No, the free parameter is the slope parameter - "b" in $E(y)=b(100-x)=100b-bx$. As soon as you know the slope, the intercept is known. You can enforce that by letting $x_2=100-x$ and then fitting regression through the origin, but that ignores the fact that the variance will reduce as you approach that fixed point; indeed with your red data points it looks like you have spread proportional to mean. If that's a reasonable assumption, there's a few possible choices with how to incorporate that. ... ctd $\endgroup$
    – Glen_b
    Commented Dec 2, 2015 at 11:52
  • 1
    $\begingroup$ ctd... One you can easily do in Excel is as follows: if you believe spread is proportional to mean you're fitting $y = b x_2 + x_2 e$ for $\text{Var}(e)$ constant. Dividing through by $x_2$ gives: $y/x_2 = y/(100-x) = b + e$. This converts it from a regression through the origin with changing spread to fitting only a constant term, with constant spread (but it does rely on the spread assumption being close to right). Note that this $b$ is effectively the negative of your slope. $\endgroup$
    – Glen_b
    Commented Dec 2, 2015 at 11:59
  • 1
    $\begingroup$ Note that your datasets would usually be called variables (as @Glen_b has done throughout). $\endgroup$
    – Nick Cox
    Commented Dec 2, 2015 at 13:30

2 Answers 2

3
$\begingroup$

If by "influence" you mean the magnitude of output change for a unit change in the input, then slope is your measure.

R^2 gives you a measure of "explained variance" (as Ivo already noted), that is - how well your model describes the output variations against input variations.

So, to answer your specific question:

"which Y dataset is more influenced by the X dataset?"

Y1, because it has a higher average difference in output magnitude for the same levels of change in input magnitude.

Y1 accidentally has also a higher R^2 value, but even if it was lower than for Y2, with the same slope, the answer would be the same.

Hope I helped.

$\endgroup$
3
  • $\begingroup$ I would just that it's important to use correct terminology: A dataset cannot "influence" anything -- it's just data. Are Y1 and Y2 different outputs/output features or just different datasets of the same input/output model? $\endgroup$ Commented Dec 2, 2015 at 12:05
  • $\begingroup$ They are two different outcome datasets of the same model. If "influence" is not correct terminology, what would be? $\endgroup$
    – FaCoffee
    Commented Dec 2, 2015 at 12:15
  • 1
    $\begingroup$ Well, it depends a what is the difference between the datasets. If they, for example, describe the response (Yx) of two different groups of subjects on a same treatment drug (X), then you could say: "In group 1, the treatment has a higher effect, compared to group 2 -- where effect size is taken as the slope of the regression line" $\endgroup$ Commented Dec 2, 2015 at 13:26
2
$\begingroup$

This plot gives you two things: First, X is more strongly correlated with Y1 than with Y2, since R2 is higher for Y1. R2 is a quantification of the explained variance. Second, the slope of Y1 is more steep than Y2 meaning that it changes more as X changes. Does that answer your question?

$\endgroup$
2
  • $\begingroup$ Kind of. So, is the slope the only metric I can refer to or are there other metrics which are the result of more complicated procedures (e.g., ANCOVA)? $\endgroup$
    – FaCoffee
    Commented Dec 2, 2015 at 10:23
  • 1
    $\begingroup$ Well, in this case it could be either slope or R2 (they are not the same). For other procedures there are similar measures (e.g. R2 or group mean differences). $\endgroup$
    – Ivo
    Commented Dec 2, 2015 at 10:29

Your Answer

By clicking “Post Your Answer”, you agree to our terms of service and acknowledge you have read our privacy policy.

Not the answer you're looking for? Browse other questions tagged or ask your own question.