0
$\begingroup$

I am analyzing this data.

Here is my code

library(fpp)
library(urca)

setwd("C:/Users/kuco/Desktop") #where is the file folder

dt<-read.csv("test.csv",header = FALSE) #read the file

t<-ts(dt,start = c(1997,1),frequency = 12) #put it into time series data

fit1<-auto.arima(t,stepwise = F,approximation = FALSE,ic="aic",D=1) #find the best model    
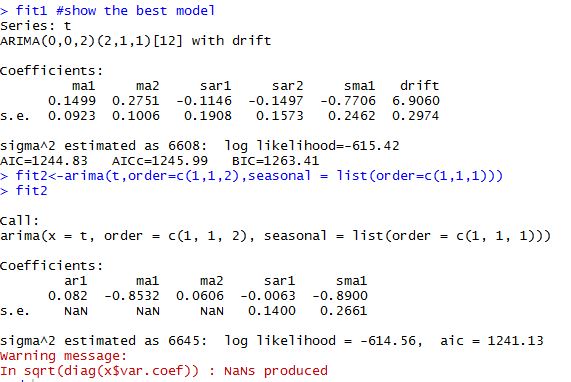
fit1 #show the best model

fit2<-arima(t,order=c(1,1,2),seasonal = list(order=c(1,1,1)))    
fit2

But it turns out that the arima(1,1,2)(1,1,12)[12] is better than the model from auto.arima(). So what can I do to get the lowest AIC model? enter image description here
$\endgroup$
4
  • 1
    $\begingroup$ You cannot directly compare the AIC for models with different integration orders. Thus your AIC comparison does not tell which model is actually better. $\endgroup$ Commented Feb 22, 2017 at 15:10
  • $\begingroup$ i select minimize the aic when using the auto.airma, it should give the model with the lowest aic. :> $\endgroup$
    – Kefei
    Commented Feb 22, 2017 at 17:29
  • $\begingroup$ If you check the algorithm behind auto.arima, you will see that AIC is used within a fixed order of integration, but not across them. The order of integration (seasonal and simple) is determined by tests (OCSB and KPSS, respectively). $\endgroup$ Commented Feb 22, 2017 at 17:45
  • $\begingroup$ Your SMA coefficient (-.7706 or -.8901) suggests possible unwarranted seasonal differences as it is in the neighborhood of -1.0. $\endgroup$
    – IrishStat
    Commented Feb 23, 2017 at 23:27

1 Answer 1

4
$\begingroup$

As noted in the comments, you cannot compare AIC values between models with different orders of differencing.

For that reason, the order of differencing is not chosen by AIC in auto.arima. Instead, unit root tests are used.

Even after the differencing is selected, the model returned will not necessarily have the minimum AIC because various other checks are done to ensure the model is well-behaved and numerically stable. For example, the model you fit is returning NaN values for some standard errors -- a sign of numerical instability in the likelihood. Such a model would never be returned by auto.arima. It also avoids models that have roots close to the unit circle.

$\endgroup$
0

Your Answer

By clicking “Post Your Answer”, you agree to our terms of service and acknowledge you have read our privacy policy.

Not the answer you're looking for? Browse other questions tagged or ask your own question.