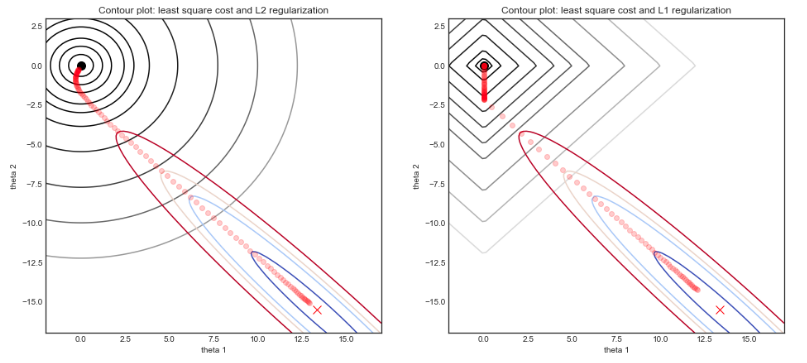
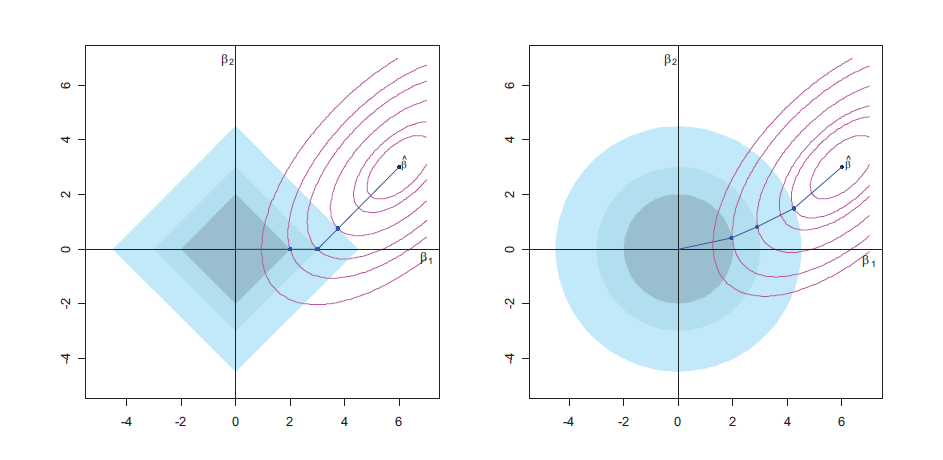
Recall that the Lasso minimization problem can be viewed as the minimization of two terms: $OLS + L_1$. To answer your question:
The intersection depends on the "graphical position" of the OLS
solution. But I can't explain to myself how the dependence works.
- The solution to the constrained optimization lies at the intersection between the contours of the two functions, and this intersection varies as a function of $\lambda$. For $\lambda = 0$ the solution is the MLE (as usual) and for $\lambda = \infty$ the solution is at $[0,0]$.
- Since at the vertices of the diamond, one or many of the variables have value 0, there is a non zero probability that one or many of the coefficients will have a value exactly equal to 0.
As you can see from your picture, there must be some values of $\lambda$ for which the solution does not take place at the vertex of the diamond. The solution cannot simply jump from the OLS minimum (when $\lambda = 0$) to a vertex of the diamond.
This is a misunderstanding many people have. The lasso doesn't magically set coefficients to zero ! It optimizes the lasso cost function, and the particular structure of this optimization problem makes it likely that the solution lies at the vertex of the diamond.
Can some of you give me some graphical intuition in the case of p=2, when
the LASSO will not set coefficients to zero?
The answer is every time the optimal solutions is not at a vertex of the diamond. Now to answer the question you have not asked.
What makes it more likely for the lasso coefficient to not be zero
One obvious factor is when features are correlated - or if there is strong multi-correlation in your data set. Visually this will have the effect of "flattening" the OLS cost function in one direction (in 2d) and thus will strongly influence the path of the lasso solution by forcing it to take a less "direct" path towards one of the vertex. See this picture for a case where the two features are very correlated.

If there were less correlation, the OLS contour plot would look more circular and the lasso solution may converge faster to a vertex. But again this depends on the particular shape of the OLS cost function for your given data set. In this case the OLS solution has a valley that is at an angle w.r.t the $0,0$ point. This where the notion of graphical position comes from
Sources
This post is strongly based on my previous post - For anyone interested, you can find most of the code and associated mathematical derivations on my blog and at this page


