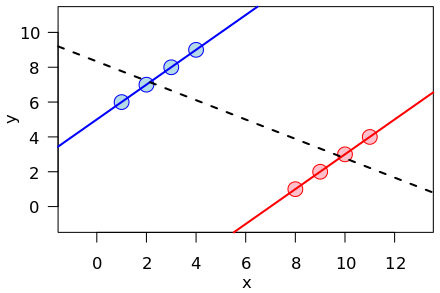
This is not that much unusual and in fact it can be even the case that im the overall sample the odds ratio is >1, let's say OR= 3.98 as in your case, but in both subgroups the odds ratio is even less than 1! This sounds impossible at first glance but the following picture from wikipedia visualizes this effect which is called the simpson's paradox:

In this picture the black dotted line shows for the whole sample a negative effect while the two subgroups have positive effects as indicated by the blue and the red line. The same paradox effect can occure with odds ratios.
So what I am saying is that there are situations where the results from the subgroups seem not to be compatible with the whole sample as it is in your data or the subgroups even seem to contradict the whole sample as in the examples in the links I provided. To my knowledge there is no simple universal rule how to interpret such findings but you have to consider theoretical plausible mechanisms (as you can see in the literature). I can also suggest reading this paper that shows the logic behind th simpson's, the lord's paradox and the suppression effect which the authors all together call the reverse effect.
EDIT
Thanks to comments from Noah who mentioned non-collapsibility. This paper reviews "previous explanations of Simpson's paradox that attributed it to two distinct phenomena: confounding and non-collapsibility.". To my understanding this means that the problem you describe is called the simpson's paradaxon in both cases, confounding and non-collapsibility. maybe the paper claryfies which of the two mechanisms is going on with your data.

