1
$\begingroup$

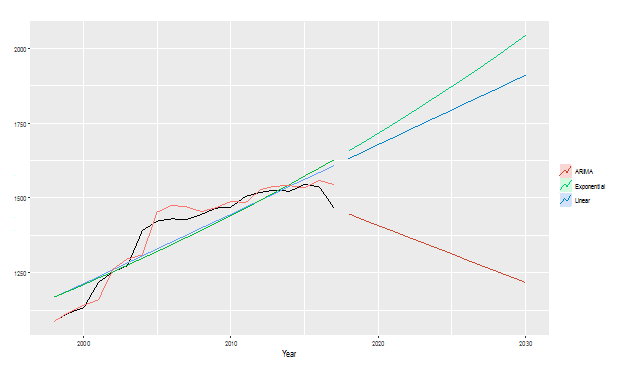
I have tried forecasting next 13 years data point by using past 20 years data (1998-2010) available in the following graphs. I used three models to compare- linear regression, exponential regression, and ARIMA. In the first image ARIMA tend to fit the data well and prediction is clearly better than other two models. In the second image though ARIMA fits the data well, but none seems to have a good prediction. I think as in the final year, data had a sharp fall, ARIMA showing a sharp decrease in the next years as well! However, it had a increasing trend in the previous 18 years! Any idea?

My second question is- is there any situation where Linear or Exponential regression can better predict than ARIMA model?

dput(<br/>   
data<-c(1796.0, 1737.0, 1745.0, 1829.0, 1857.0, 1885.0, 2088.0, 2112.0, 2137.0, 2150.0, 2168.0, 2219.0, 2233.0, 2249.3, 2291.5, 2307.3, 2325.4,
2379.7, 2385.3, 2407.0) <br/>                                                           
data<-ts(data,start=1998)    <br/>                                                              
fit.arima<-auto.arima(data)<br/>
fcast.arima<- forecast(fit.arima)<br/>
autoplot(data) +
   autolayer(fitted(fit.arima), series = "arima") +
   autolayer(fcast.arima, series="arima", PI=FALSE) +
   xlab("Year") + ylab("Employment") +
   ggtitle("") +
   guides(colour = guide_legend(title = " "))<br/>   
)


dput(<br/>   
data<-c(1090.0,1118.0, 1135.0,1218.0,1255.0,1275.0,1391.0,1424.0,1432.0,1430.0,
1447.0,1468.0,1471.0,1507.2,1520.5,1526.4,1524.4,1545.6,1539.0,1466.4)<br/>
data<-ts(data,start=1998) <br/>
fit.arima<-auto.arima(data) <br/>
fcast.arima<- forecast(fit.arima) <br/>
autoplot(data) +
   autolayer(fitted(fit.arima), series = "arima") +
   autolayer(fcast.arima, series="arima", PI=FALSE) +
   xlab("Year") + ylab("Employment") +
   ggtitle("") +
   guides(colour = guide_legend(title = " "))<br/>   
)
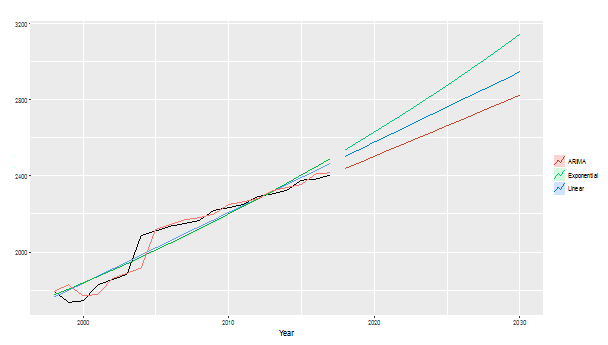
Test Data 1: Forecasting (2018-2030)

Test Data 2: Forecasting (2018-2030)

$\endgroup$
5
  • $\begingroup$ How did you select the orders of your ARIMA model? Can you edit your post to include your data? $\endgroup$ Commented Sep 20, 2019 at 8:21
  • $\begingroup$ I used auto.arima function in R, for the first one it used ARIMA(0,1,0) with drift, and for the 2nd one ARIMA(0,2,1). I am adding data in my post. $\endgroup$ Commented Sep 20, 2019 at 13:29
  • $\begingroup$ @StephanKolassa I also used NNAR, which seems to underestimates to a large extent! $\endgroup$ Commented Sep 20, 2019 at 14:54
  • $\begingroup$ Ah. I don't quite understand your data. Can you please post them in a way we can use them without having to type them down again? Best to use dput() on whatever you submit to auto.arima(). $\endgroup$ Commented Sep 20, 2019 at 15:28
  • $\begingroup$ @StephanKolassa now see! $\endgroup$ Commented Sep 20, 2019 at 17:37

2 Answers 2

3
$\begingroup$

First, forecasting 13 years ahead from 20 years of historical data is very bold.

Second, the reason why you get a decline with ARIMA is probably because of the sudden sharp decrease in the data in the second plot.

Third, it doesn't seem like there is really any pattern to your data, which is probably why the models are struggling to find any sensible results.

In general, ARIMA should perform better than regression for forecasting time series data.

$\endgroup$
5
  • $\begingroup$ Don't you think it's better to have something than nothing in hand if you want to get a picture about future! May be it can be adjusted with expert's opinion. Another point is I had 36 years historical data, which represents some country employment. However, it faced war from 1985-1997 and data was very unusual that time. Before 1997 pattern and after 1997 pattern was very different. So, isn't it logical not use that part of data in forecasting? $\endgroup$ Commented Sep 20, 2019 at 6:20
  • 1
    $\begingroup$ @MahmudulHasan Sure, something is better than nothing, however you still need a sensible something. For the second part, that depends on the data. If you really think that the previous data comes from a different process, then you can exclude it, since you are not really interested in. However, if this is about a period when something different happened, you can still keep it in the data and process it appropriately, such as using a dummy variable for war. $\endgroup$ Commented Sep 20, 2019 at 6:23
  • $\begingroup$ So, what if I want to forecast this data, do you suggest I should solely rely on expert's opinion. On more thing, does 1st image looks have no trend as well? $\endgroup$ Commented Sep 20, 2019 at 6:27
  • 1
    $\begingroup$ @MahmudulHasan Personally I don't see clear patterns in the data, the first plot looks like it might keep increasing, but the second looks like it could go either way. You may be better off using some simple predictions, such as the naive method. $\endgroup$ Commented Sep 20, 2019 at 6:39
  • $\begingroup$ You say "In general, ARIMA should perform better than regression for forecasting time series data." I say autobox.com/pdfs/regvsbox-old.pdf $\endgroup$
    – IrishStat
    Commented Sep 21, 2019 at 18:10
1
$\begingroup$

Modelling is not about selecting a priori a specific type of equation BUT rather extracting the model specifics from the data in an iterative manner as presented here https://autobox.com/pdfs/ARIMA%20FLOW%20CHART.pdf in order to optimally/opportunistically combine linear, exponential smoothing and arima components while dealing with latent deterministic structure such as pulses , level/step shifts,local time trends and/or seasonal pulses AND possible transience in either model parameters or model error variance through time.

The whole idea is to use Exploratory Data Analysis tools (EDA) to evolve/deterimine the underlying model in order to separate signal and noise via an iterative self-checking approach as originally presented by Box & Jenkins and improved since.

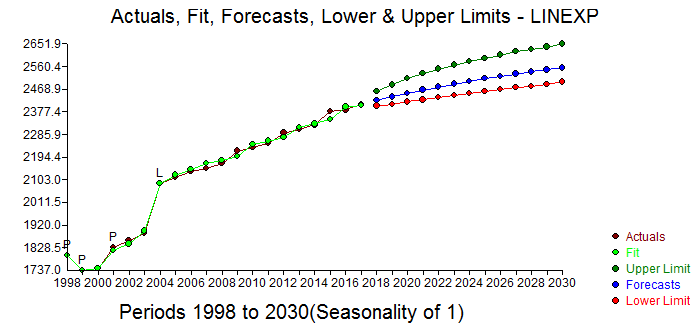
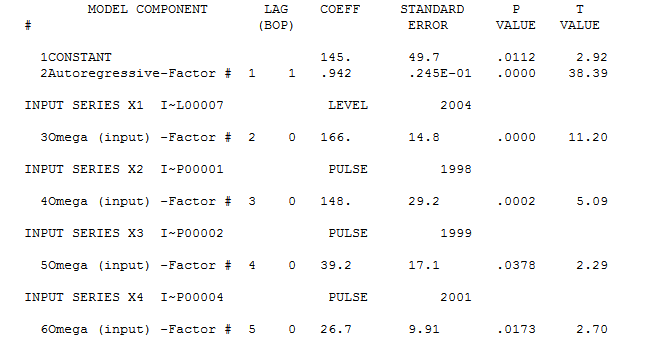
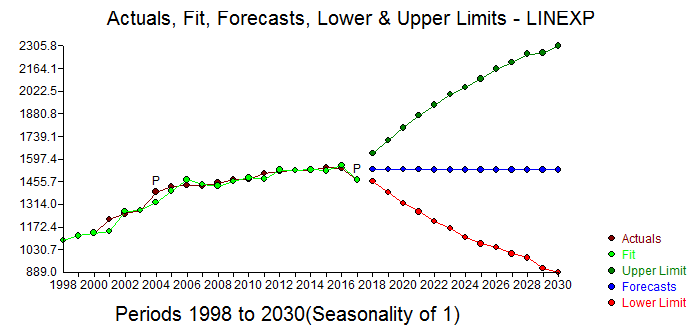
In your first example the deterministic structure required is a level shift (intercept change) and a few pulses with an arima (1,0,0) nearly (0,1,0) while the second example it is simply two pulses with an arima (0,1,0) .

first example:

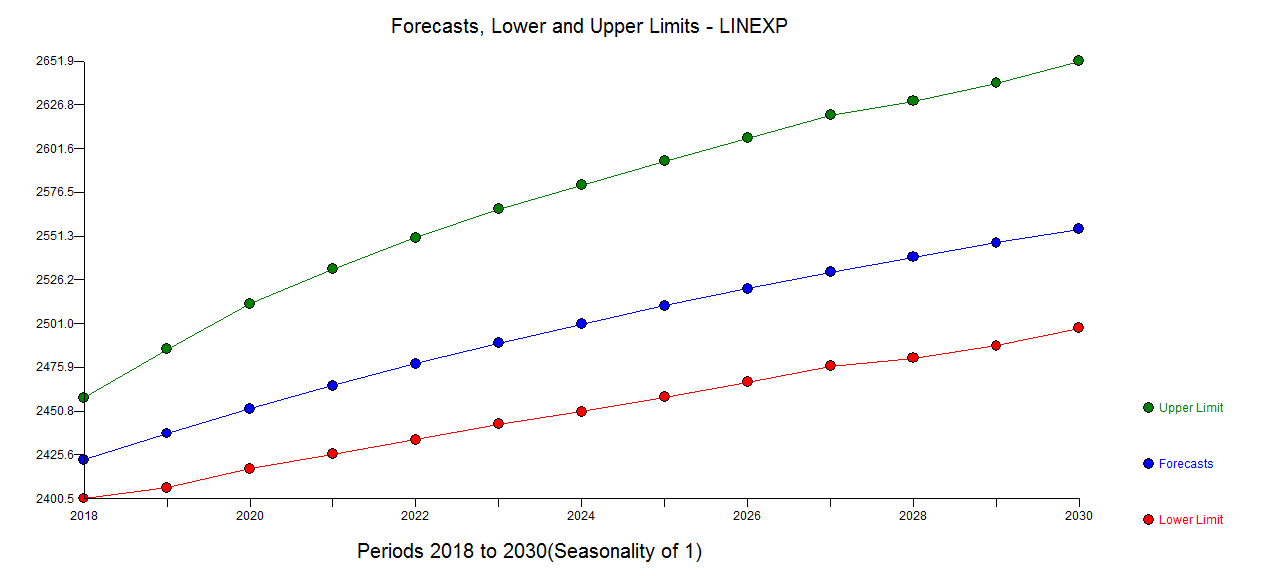
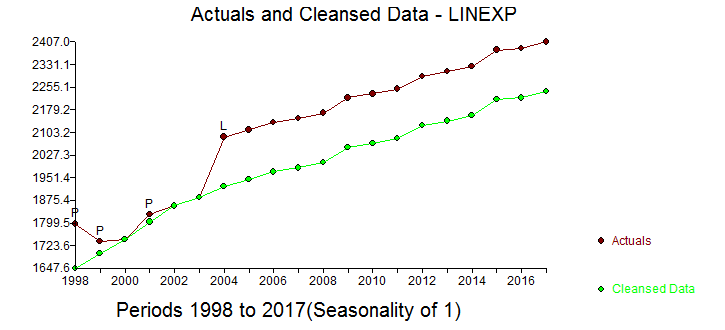
There is a very clear pattern in the data as shown here enter image description here . Your 20 values are adequately described by a hybrid model using an AR(1) and a step/level shift along with 3 pulses . enter image description here and here enter image description here and here enter image description here

The tools (approaches) that you were considering are presumptive in form whereas your data has it's own message. This data has not only a strong memory but has been affected by external activity causing the step.level shift and the 3 pulses.

here are the forecasts for the next 13 periods enter image description here

The method used here to form the model is called Intervention Detection as detailed here and everywhere else http://docplayer.net/12080848-Outliers-level-shifts-and-variance-changes-in-time-series.html . Search SE for "INTERVENTION DETECTION" . It might behoove you to investigate the true cause of the level/step shift in order to more intelligently forecast this series.

Here is the Actual and Cleansed plot enter image description here

The reason that arima (memory) doesn't work (alone) is that there is determinstic structure in the data .

second example:

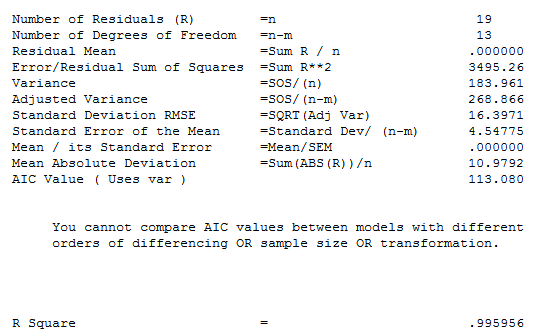
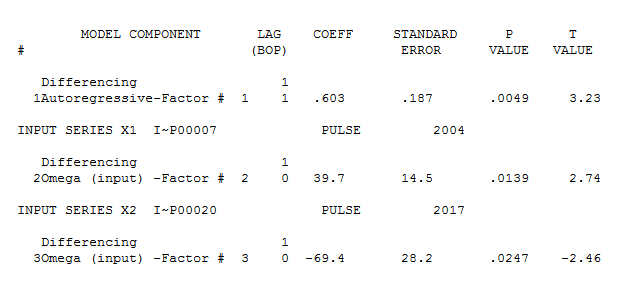
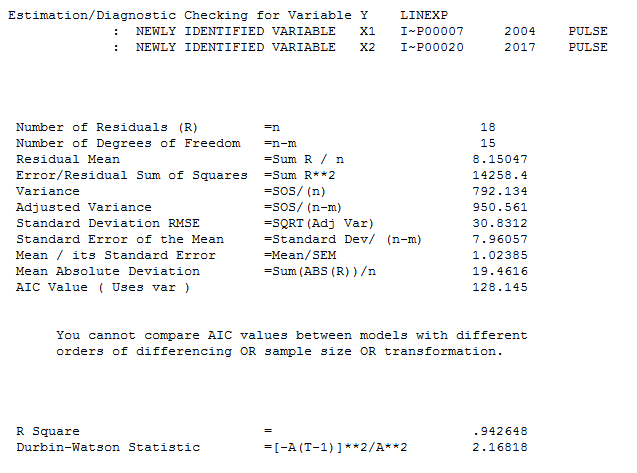
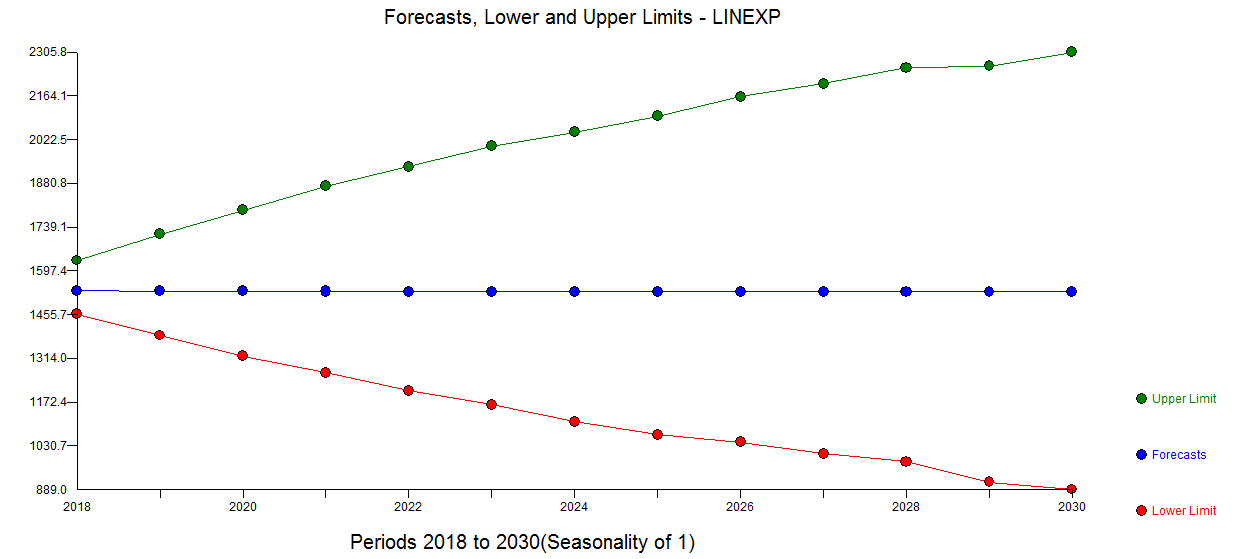
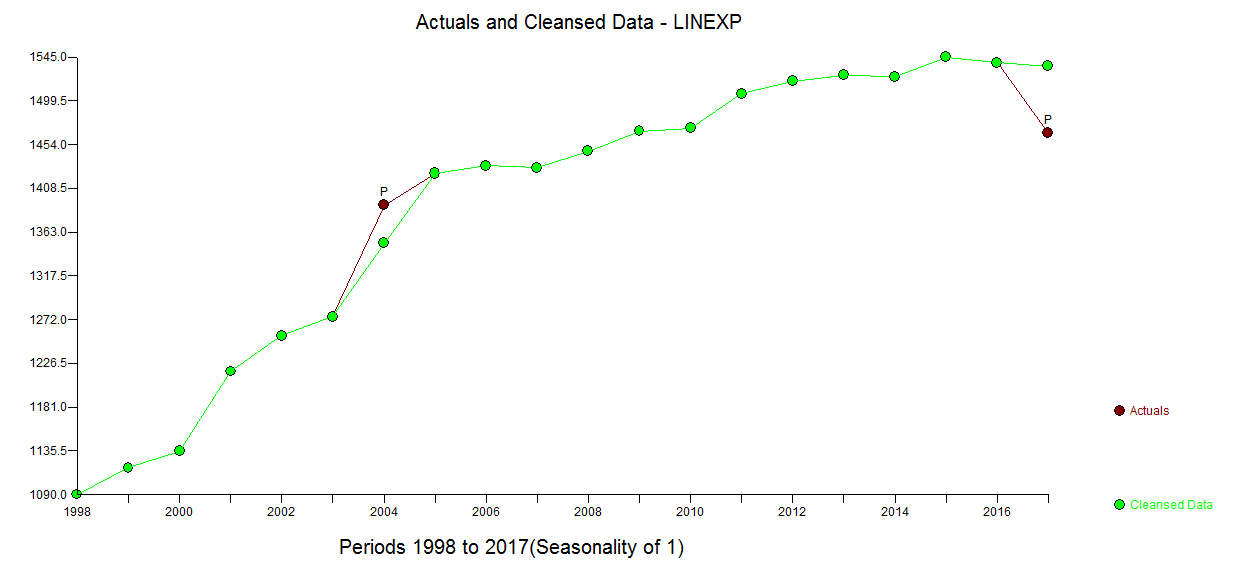
This is also a hybrid model arima (1,1,0) with two pulses reflecting external deterministic inputs. The Actual/Fit and Forecast is here enter image description here with equation here enter image description here and here enter image description here with statistical summary here enter image description here and forenter image description hereecasts here . The Actual and cleansed graph is here enter image description here

It is critical to assess whether the anomaly (pulse) downwards at the last point is "real and to be believed" or "a temporary change" . If it is temporary then the forecasts given are to be used , however if it is permanent then subtract 69.4 for each forecast period.

I used AUTOBOX an integrated piece of software that I have helped to develop but there a number of alternative software tools that can be cobbled together to give similar results as to the ideas that I have presented.

$\endgroup$

Your Answer

By clicking “Post Your Answer”, you agree to our terms of service and acknowledge you have read our privacy policy.

Not the answer you're looking for? Browse other questions tagged or ask your own question.