0
$\begingroup$

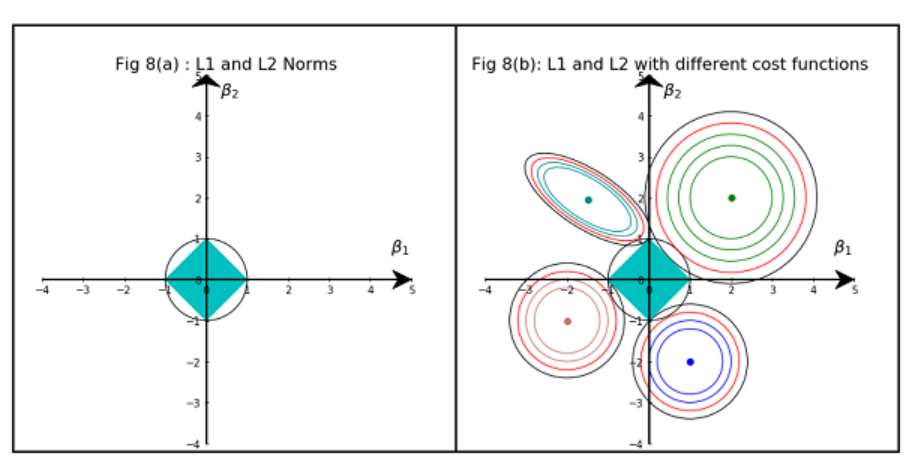
I read a tutorial here. In which, I came across the below plots

enter image description here

I read an explanation quoted Fig 8(a) shows the area of L1 and L2 Norms together. For same amount of Bias term generated, the area occupied by L1 Norm is small. But L1 Norm doesn’t concede any space close to the axes. This is what causes the point of intersection between the L1 Norm and Gradient Descent Contour to converge near the axes leading to feature selection.

From the above graphs and explanation, I can understand the below

a) Area occupied by L1 norm is small when compared to L2 norm

But I didn't understand what the author means as But L1 Norm doesn’t concede any space close to the axes. and how this leads to feature selection?

can help me understand this, please?

$\endgroup$
5
  • 1
    $\begingroup$ One answer in the duplicate thread uses the same image. For more about this see stats.stackexchange.com/search?tab=votes&q=lasso. $\endgroup$
    – whuber
    Commented Feb 10, 2021 at 14:32
  • $\begingroup$ The quote is considering l1 and l2 balls of equal radius. It says that the l1 ball has less total volume. But, if we restrict our attention to the vicinity of the axes, both balls occupy similar volume in this sub-region. So, if you spread out the same amount of mass uniformly over each ball then, in the l1 ball, the mass would be concentrated closer to the axes. $\endgroup$
    – user20160
    Commented Feb 10, 2021 at 14:49
  • $\begingroup$ hi @user20160 - Is there anyway you can explain this visually? Sorry, if I am asking you for too much help. Unfortunately, am not from a CS background but trying to learn ML $\endgroup$
    – The Great
    Commented Feb 10, 2021 at 14:55
  • $\begingroup$ I think I didn't understand this So, if you spread out the same amount of mass uniformly over each ball then, in the l1 ball, the mass would be concentrated closer to the axes... What I inferred from the vicinity of axes is that both L1 and L2 ball have 4 points (in 4 quadrants) in the same position. $\endgroup$
    – The Great
    Commented Feb 10, 2021 at 14:57
  • $\begingroup$ Regarding the 'vicinity of the axes' comment...In the figure you posted, imagine painting red lines over the axes (with a little bit of width to them, but not too much). Count the number of pixels in the image that fall within the l2 ball and also overlap with the red lines. Do the same for the l1 ball. The two numbers should be similar. Regarding the 'concentration' comment, imagine spreading 1 million points uniformly over the surface of each ball. Measure the distance of each point to the axes. The average distance will be less for the l1 ball, compared to the l2 ball. $\endgroup$
    – user20160
    Commented Feb 10, 2021 at 15:13

1 Answer 1

1
$\begingroup$

It means when we near to axis for an optimization (minimization or maximization) task, we will have a narrower and sharp neighborhood to reach to the optimal point in Norm 1, in contrast to Norm 2.

$\endgroup$
2
  • $\begingroup$ Sorry, can you elaborate in simple terms, please? I am not from CS background. Based on what (in the plot), do they say that L1 Norm doesn’t concede any space close to the axes? upvoted btw $\endgroup$
    – The Great
    Commented Feb 10, 2021 at 14:09
  • $\begingroup$ I didn't understand your answer. May I know how to do they assess/find out that L1 norm doesn't concede space close to the axes? $\endgroup$
    – The Great
    Commented Feb 10, 2021 at 14:13

Not the answer you're looking for? Browse other questions tagged or ask your own question.