I am working with an agricultural dryer that gradually dries grain. During each drying run, many data are taken, including information about the moisture content distribution. The moisture content distribution is collected by a moisture meter which measures what proportions of the grain are in what moisture % bin from 8-9% up to 49-50%. This distribution is often plotted as a histogram and looks like this:
 The distribution above is an example of a "bad" distribution at the start of the drying run. At this time the mean moisture is typically centered around 25-30% moisture.
Here is an example of a "good" distribution:
 You can see that it has a rough gaussian shape and that the mean is around 14% moisture. You can imagine that there is a huge variety of distributions between these two.
What I would like to do is develop a statistic to judge a distribution's 'quality'.
Features of a 'quality' distribution:
- low moisture (but not too low)
- narrow
- smooth
- unimodal
- low skew
Requirements
I want this statistic to
- smoothly increase (or decrease)
- have a minimum number of inflections (ideally none)
- peak at the end of drying
- have a reasonably small range
- be useful for judging any given distribution
So far I've tried a variety of ways of combining the base statistics of the distribution: the mean, standard deviation, IQR, skew, kurtosis, etc, but nothing so far has given me a value that has the above requirements.
Here is an example:
$$\text{'Quality'} = \frac{\text{normality test}}{\mu \times \sigma \times \text{IQR}}$$
The normality test I am using is the D'Agostino and Pearson statistic. Note that I min-max normalize each of the values in this equation.
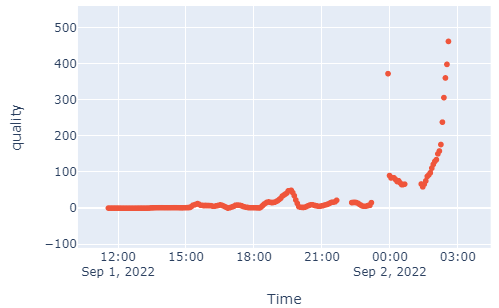
A plot showing the 'quality' through time:

You can see that it has multiple peaks (bad) and does not gradually increase.
Maybe I'm getting close, but I feel like this approach is too simplistic. I appreciate any other ideas for solving this seemingly easy problem.
