4
$\begingroup$

This answer to a question on Math Stack Exchange got me thinking about a confusion matrix as more than just a rectangular array of numbers. We don’t talk about a confusion matrix as a linear transformation, but we do call it a “matrix,” so why not think of their linear algebra properties.

It seems that the determinant of a $2\times 2$ confusion matrix is related to the phi coefficient. Determinants are related to the eigenvalues. Can the eigenvalues be useful in evaluating classifier performance (beyond being multiplied to give the determinant that is related to the phi coefficient)? Do the eigenvectors tell us anything?

$\endgroup$

2 Answers 2

7
$\begingroup$

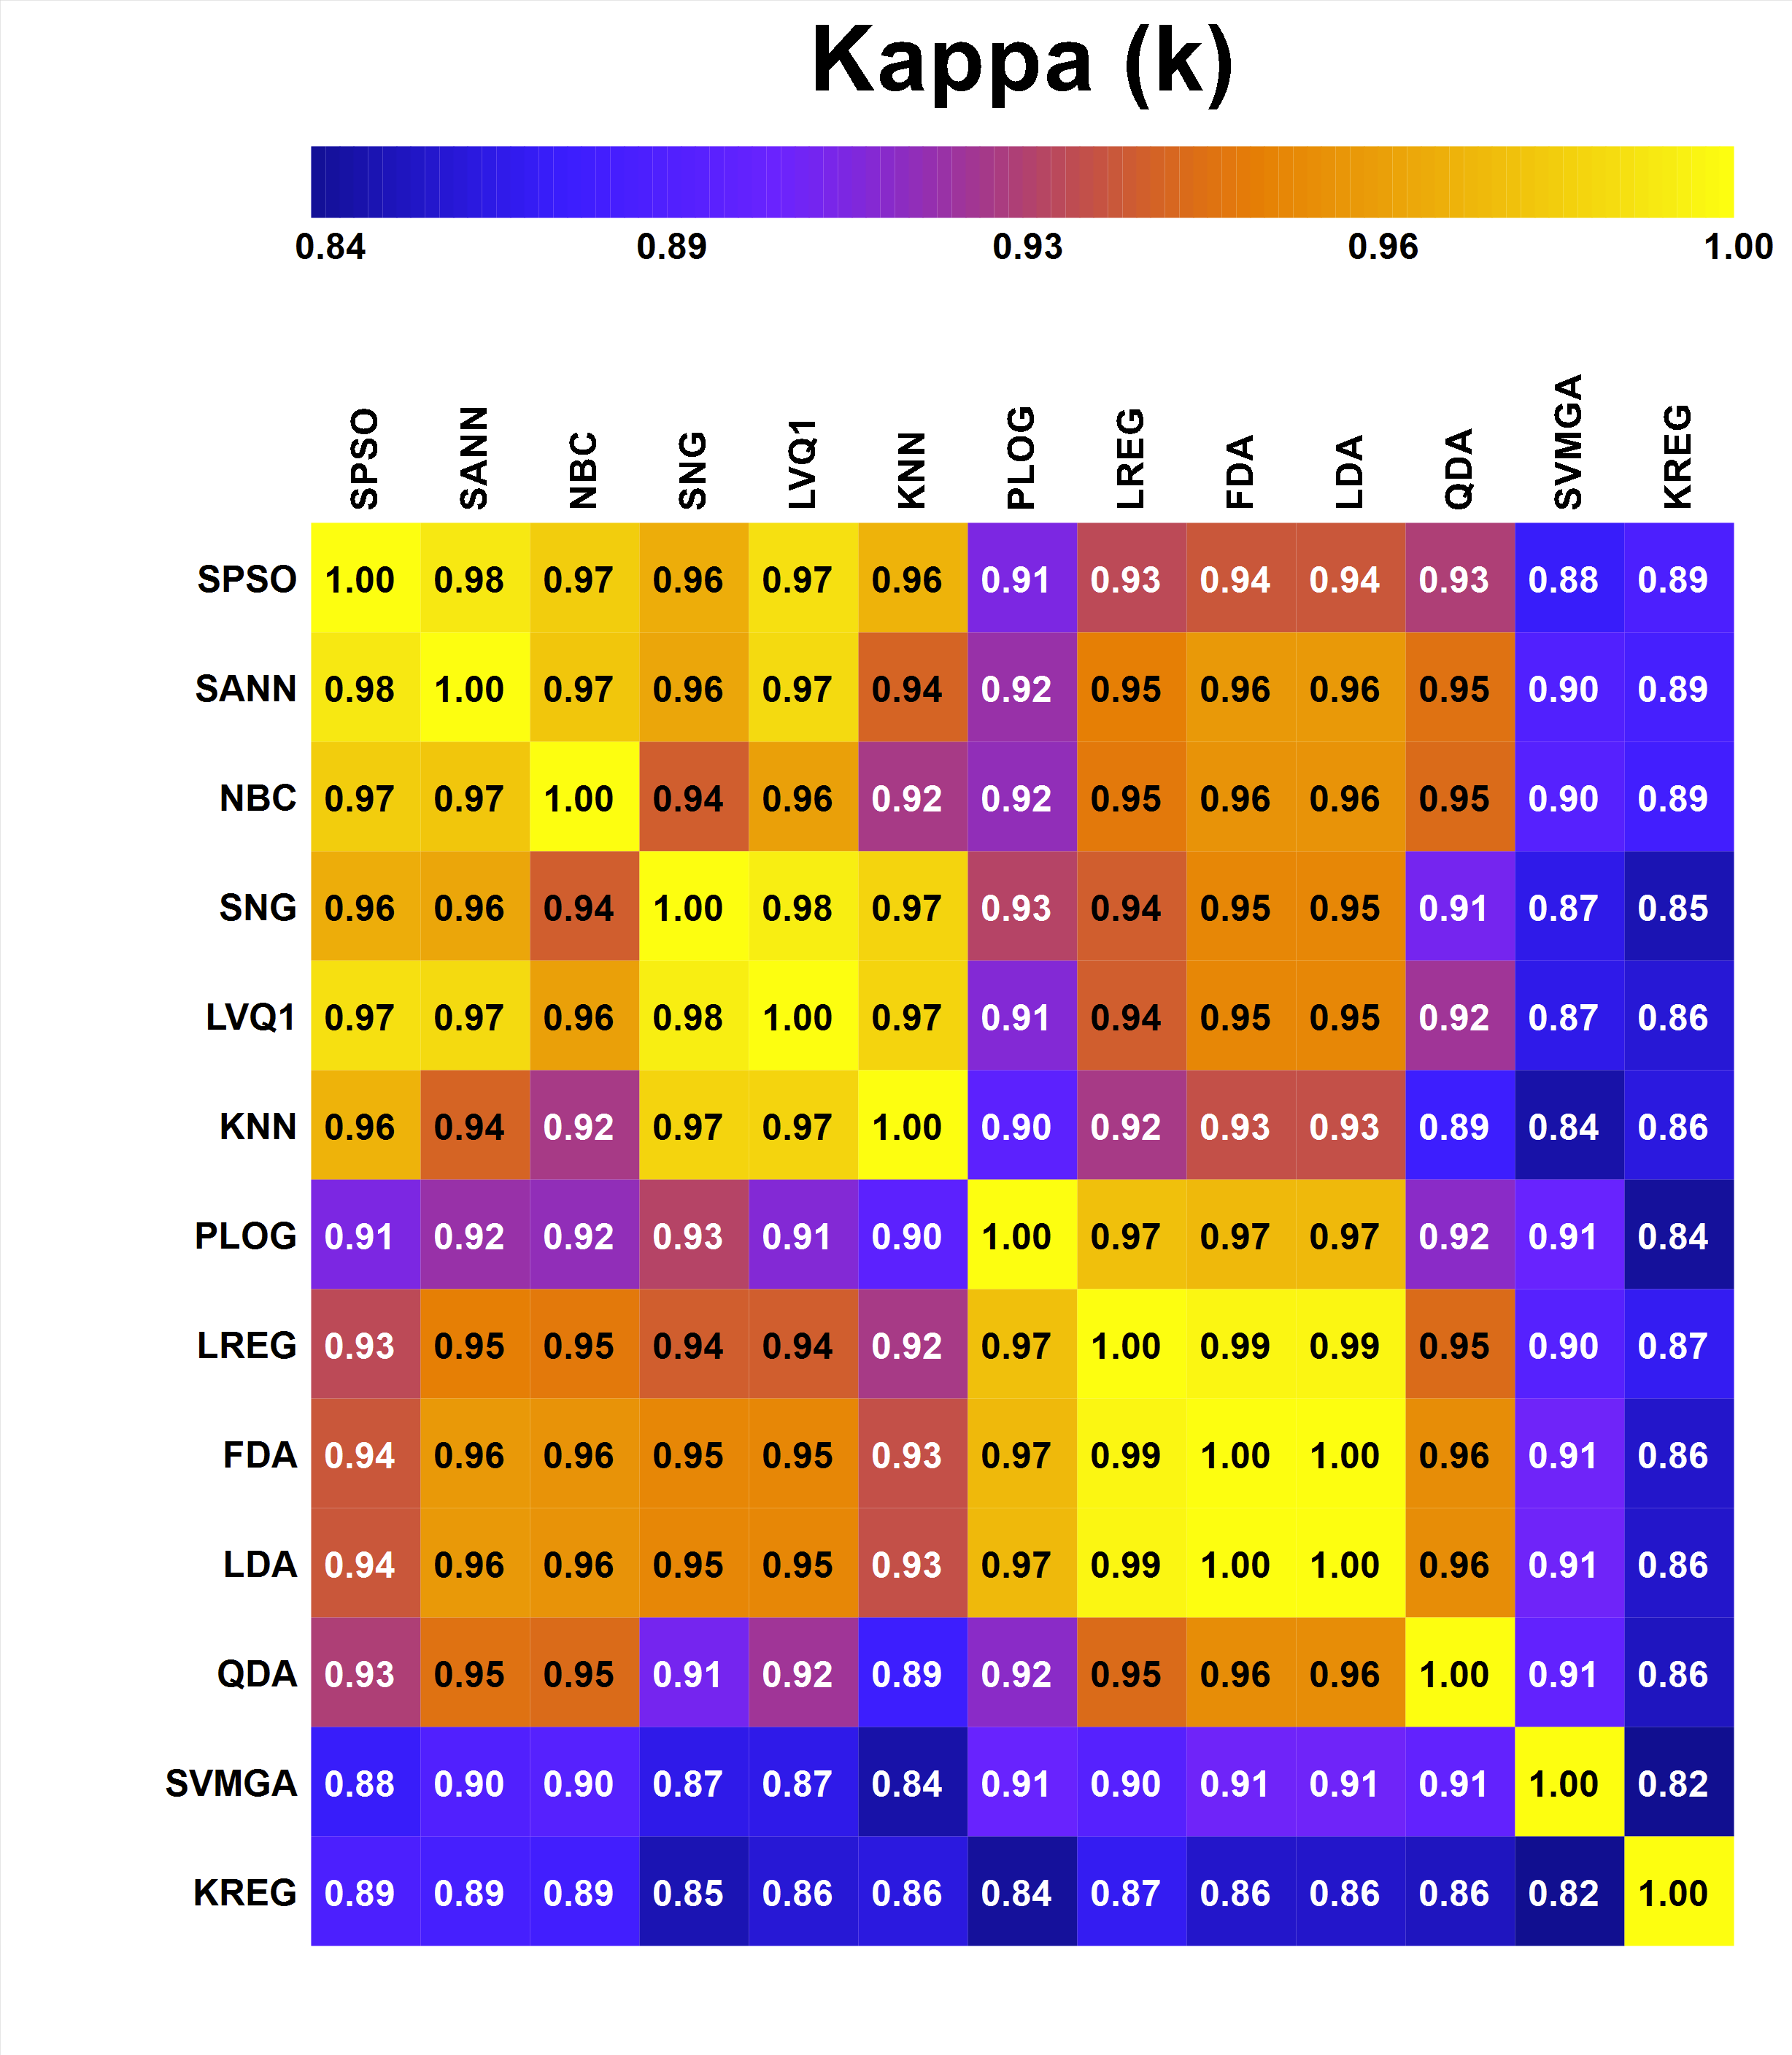
The eigenvalues would really only reveal how many classes (single classifier) or how many classifiers are correlated with one another (multiple classifiers). But if you look at the quasi-diagonalized Kappa matrix for all possible pairs of classifiers applied to the 3-class Wine dataset below:
enter image description here

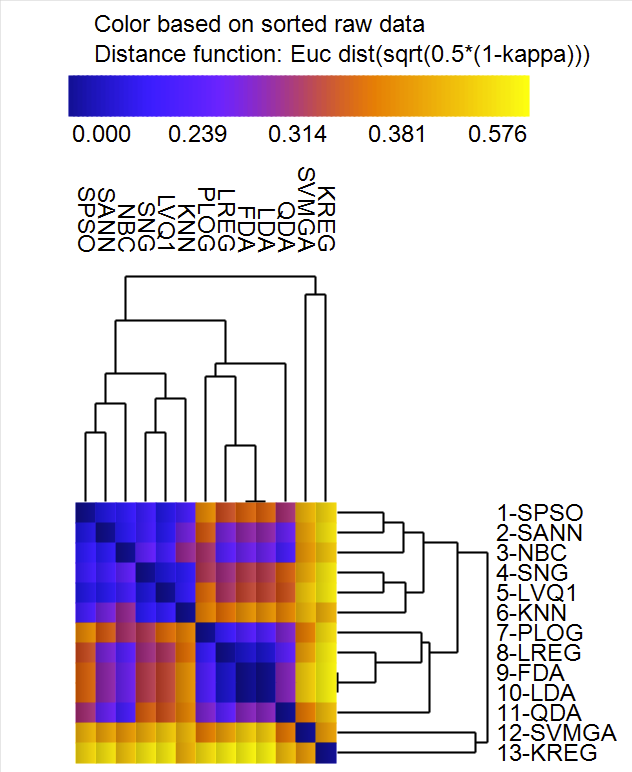
...you can then perform hierarchical cluster analysis using a modified form of Euclidean distance to see which classifiers cluster with one another:
enter image description here

Note, this Kappa matrix is a $13 \times 13$, so when looking at the clustering, I notice three large groups of classifiers which are sizes 6, 5, and 2, so I would expect the eigenvalues, $\lambda_j$, of a $p \times p$ correlation matrix (MCC) to perhaps show something similar to this. That is, you wouldn't likely have one large eigenvalue like 8 or 9, with the remaining in the other dimensions. Instead, based on the clustering, I would guess eigenvalues of e.g. 5,4,1 which gives a sum of 10 for the first 3 components, and then the remaining 10 eigenvalues equal to <1 each so that they sum to 10. Altogether, the 13 eigenvalues would sum to 13, since it can be shown that $p=\sum_j \lambda_j$ when the correlation matrix is used for eigendecomposition.

I believe you can do more surgery (drilling down) regarding discovery on classifier behavior taking this approach instead of performing eigendecomposition.

$\endgroup$
1
  • 1
    $\begingroup$ Nice graphs. Which software did you use to generate them? $\endgroup$
    – Igor F.
    Commented Feb 15 at 5:48
1
$\begingroup$

I started looking at the eigenvalues of the normalized confusion matrix. In this case, the first eigenvalue is 1 and the eigenvector gives the stable point. I like to call this intrinsic prevalence, what the model assumes the data will have based on the training set. The other eigenvalues indicate how the model degrades as you move further away.

I am trying to find some literature about it, so suggestions welcome.

$\endgroup$
1
  • $\begingroup$ Your answer could be improved with additional supporting information. Please edit to add further details, such as citations or documentation, so that others can confirm that your answer is correct. You can find more information on how to write good answers in the help center. $\endgroup$
    – Community Bot
    Commented Nov 18 at 6:48

Your Answer

By clicking “Post Your Answer”, you agree to our terms of service and acknowledge you have read our privacy policy.

Not the answer you're looking for? Browse other questions tagged or ask your own question.