Without knowing what kind of data were being assessed it's very hard to give good advice here. And really, that's all you can get. There's just no such thing as a best measure of effect size for questions like this... maybe ever.
The effect sizes mentioned in the question are all standardized effect sizes. But it's entirely possible that the means or medians of the original measures are just fine. For example, if you're measuring how long it takes for a manufacturing process to complete then the difference in times should be a perfectly reasonable effect size. Any changes in process, future measurements, measurements across systems, and measurements across factories, will all be in time. Maybe you want the mean or maybe you want the median, or even mode, but the first thing you need to do is look at the actual measurement scale and see if the effect size there is reasonable to interpret and strongly connected to the measure.
To assist in thinking about that, effects that should be standardized are things that are measured more indirectly and in many ways. For example, psychological scales can vary over time and in many ways and attempt to get at an underlying variable that is not directly being assessed. In those cases you want standardized effect sizes.
With standardized effect sizes the critical issue is not just which to use but what they mean. As you imply in your question, you also don't know what they mean and that's the critical thing. If you don't know what the standardized effect is then you can't report it correctly, interpret it correctly, or use it correctly. Further, if there are a variety of ways you'd like to discuss the data there is absolutely nothing stopping you from reporting more than one effect size. You can discuss your data in terms of linear relationship, like with product moment correlation, or in terms of relationship between the ranks with Spearman r and differences between those or just provide all the info in the table. There's nothing wrong with that at all. But more than anything you're going to have to decide what you want your results to mean. That's something that can't be answered from the information given and might require far more info and domain specific knowledge than is reasonable for a question in this kind of forum.
And always think meta-analytically about how you're reporting effects. Will people in the future be able to take the results I'm reporting and integrate them with others? Perhaps there's a standard in your field for these things. Perhaps you selected a non-parametric test primarily because you don't trust the conclusions others have made about underlying distributions and you want to be more conservative in your assumptions in a field that primarily uses parametric tests. In that case there's nothing wrong with additionally providing an effect size typically used with the parametric tests. These and many other issues need to be considered when thinking about how you place your finding in a larger literature of similar research. Typically good descriptive stats solve these problems.
So that's the primary advice. I have a few additional comments. If you want your effect size to be strongly related to the test you did then the Z based recommendation is obviously best. Your standardized effect size will mean the same thing as the test. But as soon as you're not doing that then there's nothing wrong with using most anything else, even something like Cohen's d that's associated with parametric tests. There is no assumption of normality for calculating means, standard deviations, or d scores. In fact, there are weaker assumptions than for the recommended correlation coefficient. And always report good descriptive measures. Again, descriptive measures have no assumptions you'd be violating but keep in mind their substantive meaning. You report descriptive stats that say something about your data you want to say and means and medians say different things.
If you want to discuss repeated measures versus independent design effect sizes then that's really a whole new question.


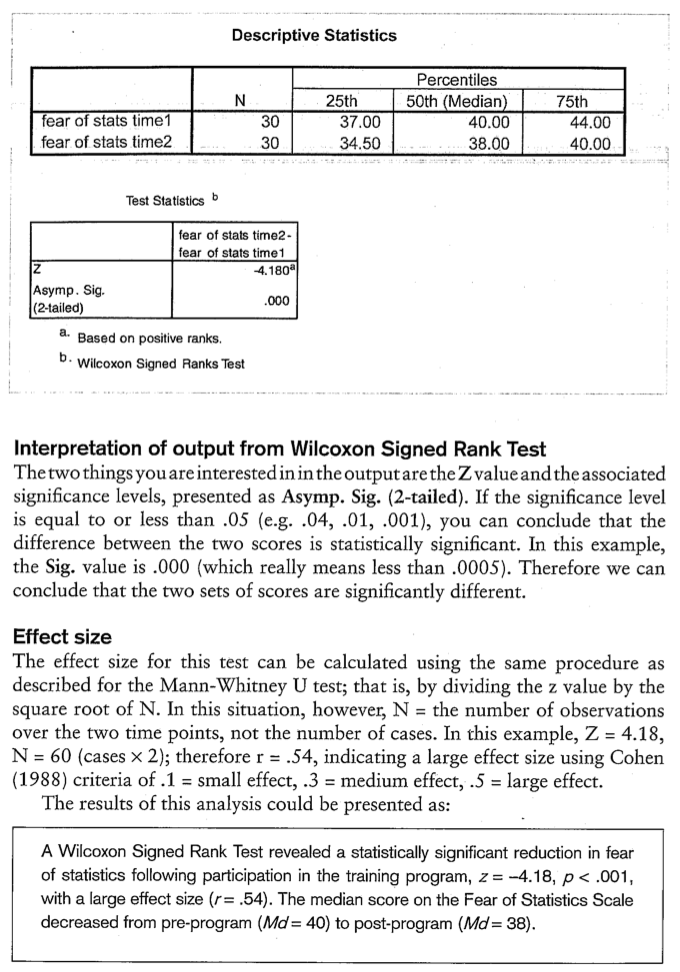
nin $\sqrt{n}$ is the number of all observations, that is the sum of the length of both vectors, i.e. $n = n_x + n_y$, not the number of participants. So the formula is the same, you only have to correctly understand what "n" stands for. If that is wrong, please educate me. This is after all what my question is aiming at. $\endgroup$