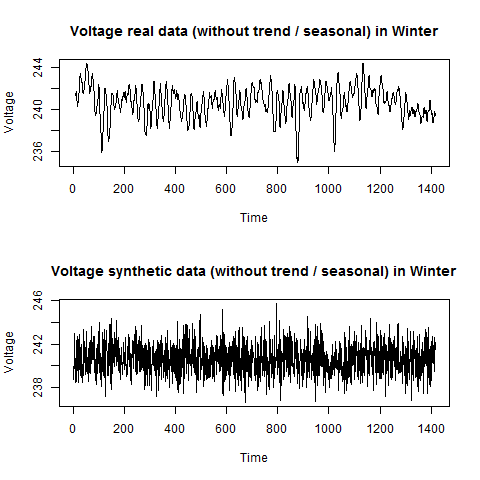
I'm studying in R a way to generate synthetic data starting from real world data and, in particular, I'm focusing on the year 2008 of the "Household power consumption" dataset (free to download at UCI Machine Learning Repository).
My problem is that the synthetic data are far from real data and I'm can't understand why.
These are the steps that my process has so far:
- I imported the data for the year 2008 and I aggregate them on hourly basis.
- I'm started to focus on the less related variable in the dataset (voltage) and I find all the components using the command
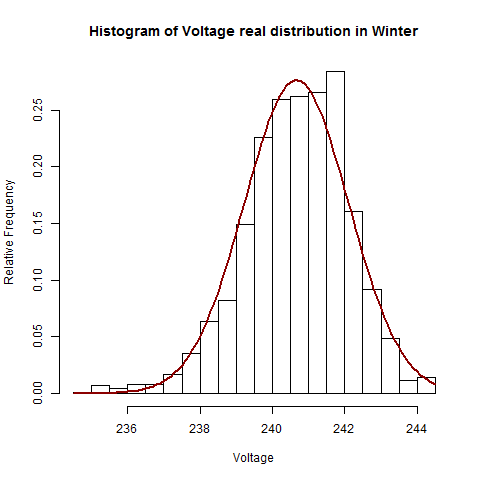
decompose(). I removed the noise effect and seasonality (I will add them later). - I divided the data in different seasons and I started from the winter, checking the histogram and I found that a normal distribution could be a good fit form my data:
- So I generated my data using
fit_w <- rnorm(length(w), mean(w, na.rm = T), sd = sd(w, na.rm = T)), but the final results are not so satisfying:
My question is: how can I generate data in a way that they will look similar to the real dataset? Because all my efforts and strategies that I tried until now will lead to similar results.

