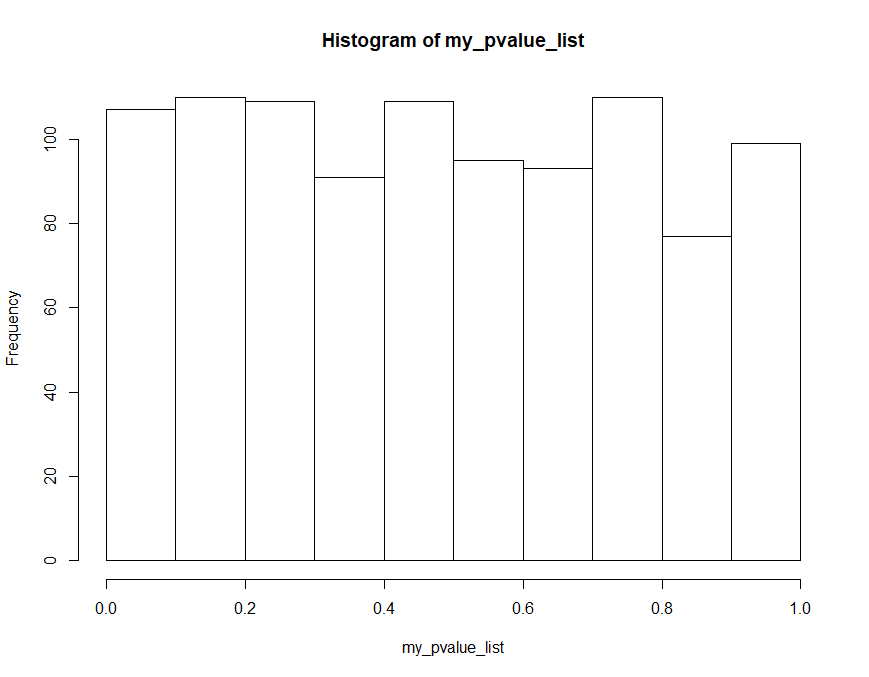
I created a short Monte Carlo script to check how z-values from z-tests and their correspond when I change different parameters.
My script is the following. I have a "population" of normal distribution, with mean 20 and SD 4. Then I take random samples, calculate the z-value of the hypothesis that mean=20 and the corresponding p-value. I do that "experiment" 1000 times.
I expect that almost 95% of z-values will be, in absolute, less than 1.96 and of course 95% of the p.values will be more than 0.05.
The code is the following:
population<- rnorm(10000, mean=20, sd=4)
my_pvalue_list<-0
my_z_list<-0

for (i in 1:1000){
n<-200
m_<- 20
sd_<-4
my_sample<- sample(population, n, replace= TRUE)
my_z <- (mean(my_sample)-m_)/((sd_)/sqrt(n))
my_pvalue<- 2*pnorm(-abs(my_z))

my_z_list[i]<-my_z
my_pvalue_list[i]<-my_pvalue
}
Then I run the following codes. Also my comments:
sum(abs(my_z_list)<1.96)
[1] 943
This is as expected, close to 95%.
 sum(my_pvalue_list>0.05)
[1] 943
This equals as expected the previous formula.
But when I try to plot the histogram of my p-values list I get a uniform distribution.
I don't understand exactly where is my error. I expected that my histogram should have a left-skewed distribution, since most of p-values are above 0.05.
Thank you in advance for the explanation.

