If I have a random variable that follows a normal distribution i.e.
$X \sim N(-3,4)$
and I want to calculate $P(|X| <1)$ how would I go about doing so, using the z values? Seeing as it's the modulus, would I only need to consider one half of the normal curve and thus calculate $P(X<1)$?
3 Answers
Remember the definition of the absolute value: $|X|<1$ means that the distance from $X$ to the origin is less than 1. Hence, if $|X|<1$, which one of the following alternatives is true?
a) $X > 0$.
b) $-1<X<1$.
c) $10^{100}<X<10^{100^{100}}$.
d) None of the above.
Now, the probability that $X$ is between two values $a$ and $b$, with $a<b$, is the area below the graph of the density of $X$ between $a$ and $b$. It is a good idea to draw a figure that depicts this area. One way to compute that area is to subtract two other areas: the area below the graph of the density of $X$ from $-\infty$ to $b$, minus the area below the graph of the density of $X$ from $-\infty$ to $a$. Make sure that you understand why this is true: draw another figure. Finally, the two areas mentioned above can be obtained, in your case, from the $z$-values, right?
No, $P(X<1)$ is different from $P(|X|<1)$. After all $-2 < 1$ but $|-2|$ isn't!
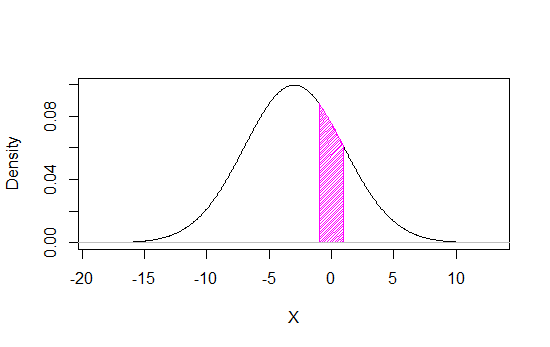
To get $P(|X|<1)$ you need to find this area:

. . .
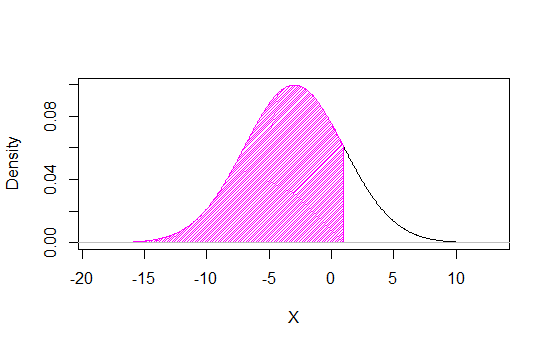
While $P(X<1)$ would be this area:

[Credit: I used the shadenorm function here, which was written by Tony Cookson. To editorialize a little, one mark of a really good utility function is one for which basic usage can be discerned from simply reading the argument list; this was one of those - paste it in, use it in the obvious way, it worked. It looks like there's a similar function shade.norm in the package asbio (see the description here)]
-
$\begingroup$ And if I wanted to calculate $P(|X|>1)$ could I do: 1 - P(-1<X<1)? $\endgroup$– MathleteCommented Mar 18, 2013 at 0:03
-
1$\begingroup$ Correct (though strictly you're leaving out some equalities at the bounds, they have probability of measure zero so teh answer won't change) - but you should probably add that question to your original post $\endgroup$– Glen_bCommented Mar 18, 2013 at 0:05
In R this should work.
X <- rnorm(100000,-3,4)
X1<- abs(x)
mean(X1<1)
.14854
This creates 100,000 random normal variables with mean -3 and sd= 4. (R uses sd as the second parameter. Make sure you use 2 if you mean variance of 4 in your example). The second line of code just takes the absolute value of the variables, then line three just checks for percentage less than 1.
R has a function (pnorm) which is the cumulative density function for the normal distribution (it also exists for many other distributions other than the normal). pnorm basically says what portion of the pdf is less than or equal to a certain number. For your example, you're looking for numbers between -1 and 1 (i.e. absolute value of 1), so pnorm(1,-3,4) will tell you $P(x<1)$. Now that will give you more than you want, because you don't want numbers smaller than $(x<-1)$. So you've got to cut out that portion of the distribution.
Writing the code pnorm(1,mean=-3,sd=4) - pnorm(-1,mean=-3, sd=4) should then give you the portion of the distribution to the left of the value $1$, but to the right of the value $-1$. I got an answer of .14998 when I ran this code. Hope this helps.
-
1$\begingroup$ Could you explain why you are advocating such an approach over using, e.g., the built-in
Rfunctions such aspnorm? It also seems unclear whether a programming solution is what the OP is searching for over, say, an explicit expression. $\endgroup$– cardinalCommented Mar 17, 2013 at 23:42 -
$\begingroup$ pnorm(1,mean=-3,sd=4)-pnorm(-1,mean=-3,4) $\endgroup$ Commented Mar 17, 2013 at 23:51
-
$\begingroup$ I think that this works too. You are right, this is better. Sorry. $\endgroup$ Commented Mar 17, 2013 at 23:51
-
1$\begingroup$ No reason to be sorry. I was fishing for more elaboration. One can gain insight and understanding through such simulations. You might consider an edit that incorporates your comment and also shows why it works. I've found in the past that a carefully constructed picture can remove all doubt from even the most mathphobic. :-) $\endgroup$– cardinalCommented Mar 17, 2013 at 23:57
-
$\begingroup$ Thanks for your help but I was wondering if I could get a more theoretical answer? What probability are you actually calculating with |X|? $\endgroup$– MathleteCommented Mar 18, 2013 at 0:01
