I would like to confirm that I am understanding the relationship between a sampling distribution of a statistic (an example of a 'statistic' would be a sample mean $\bar{x}$) and a population distribution in the context of a hypothesis test (such as a $t$-test and its associated $t$-distribution).
Suppose we have the distribution of the measured heights of all citizens from a country: let this be the population distribution. Let the population mean equal $\mu$. Next, consider an $n$-sized sample of this population, which we will denote as $T_n$, which contains members $t_1, t_2, \cdots, t_n$. Let $\displaystyle S_n= \sum_{j=1}^{n}(t_j)$ and define $\bar{x}_n=\frac{S_n}{n}$.
Now, let's say we generated an infinite number of $n$-sized samples of the height population distribution (I guess, technically, it would not need to be infinite to exhaust all possible $n$-sized sample combinations given that the country has a finite citizen population...but you get the point). Then we would have $T_n^1, T_n^2, \cdots$. Each of these samples would give us a corresponding $\bar{x}_n^i$ for any $i \in \mathbb N$. The collection of these $\bar{x}_n^i$ (when laid out as a normalized frequency plot) denote the '$n$-sized sampling distribution of the sample mean taken from the population distribution of heights'.
Assuming we are in agreement with the above ideas, here are my questions:
In general, is the sampling distribution of a statistic that is derived from an $n$-sized sample different than the sampling distribution derived from an $m$-sized sample, where $n \neq m$ (and, obviously, when both samples are being taken from the same population)?
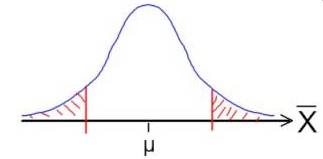
When we are conducting hypothesis tests, what is the distribution that is associated with the null-hypothesis? i.e. the little graph that you would commonly see on any youtube video about hypothesis testing...for example:

Is it correct to say that the depicted distribution above is the $n$-sized sample distribution of the sample mean assuming that the null-hypothesis is true and the mean of the population distribution is $\mu$?
If so, then:
- Why should it be the case that the center of this $n$-sized sample distribution of the sample mean is at the population mean $\mu$? Is there a particular proof describing this? For example, using our notation from earlier, is the following claim correct:
$\displaystyle \lim_{i \to \infty}\frac{\displaystyle\sum_{1}^i\bar{x}_n^i}{i}=\mu$
Said differently, if the population mean is $\mu$, then the mean of the '$n$-sized sample distribution of the sample mean' is also $\mu$. Is that right?
Next, the following test statistic (used in a $t$-test) $t=\frac{\bar{x}-\mu}{(s/\sqrt{n})}$ will have a 'Student's $t$-distribution with $n-1$ degrees of freedom'.
Which leads me to my final question:
- Why do I need to use the test-statistic distribution to preform the hypothesis test? Why is the sample distribution of the sample mean (under the null hypothesis) not a viable probability density function (PDF) in and of itself? In the case where we do not know the population standard deviation $\sigma$, I suppose it makes sense not to conduct a hypothesis test on the sample distribution of the mean (because we cannot even determine its shape). However, in the case where we do have $\sigma$, and can therefore use a $z$-distribution, it seems to me that the sample distribution of the mean could just as well be used...and the "$z$-transformation" involving the $z$-statistic is just a normalization scheme?
Edit: I have read the answers to some posts(Difference between null distribution and sampling distribution , Hypothesis testing. Why center the sampling distribution on H0?, and https://stats.stackexchange.com/questions/85804/choosing-between-z-test-and-t-test#:~:text=Use%20a%20t%2Dtest%20always,with%20large%20departures%20from%20normality). , and Hypothesis testing: understanding test statistics and their sampling distribution ), but I am still uncertain.
