I want to use an unpaired two-sample t-test of random samples of $n=40$ each. The sample data is from 4-point Likert scale assessments. I understand the t-test is not very robust to outliers, which I expect to exist within the population being sampled (true outliers, not artifacts or mistakes). I am concerned that the 4-point Likert scale will hide real outliers, compared to an 11 point scale, for example.
-
$\begingroup$ The mean is not a robust metric, which the t-test tests, so it can give misleading results if you are not careful. The alternative (also given that your data is not numeric, but ordinal) could be to use a non-parametric test. $\endgroup$– user2974951Commented Jun 29, 2023 at 7:32
-
1$\begingroup$ What do you mean by "real outliers"? The term "outlier" refers to an outlying data point. If you only have four possible values, you will not normally have outliers (unless almost all data are on one end of the scale). If an observation isn't observed as a data outlier, it doesn't make sense to say it could be a "real but hidden" outlier (at least not in the statistical sense). $\endgroup$– Christian HennigCommented Jun 29, 2023 at 9:55
-
1$\begingroup$ If you want what you apparently call "real outliers" to show up in the data, that's an issue of measurement. The four point Likert scale won't do that, but that's not an issue regarding which test to choose. Rather you need to think about how to design your measurement instrument in such a way that it measures properly what you want to measure. (But then I may misinterpret your idea of "real outliers" anyway.) $\endgroup$– Christian HennigCommented Jun 29, 2023 at 9:59
1 Answer
T-Tests and Likert Data
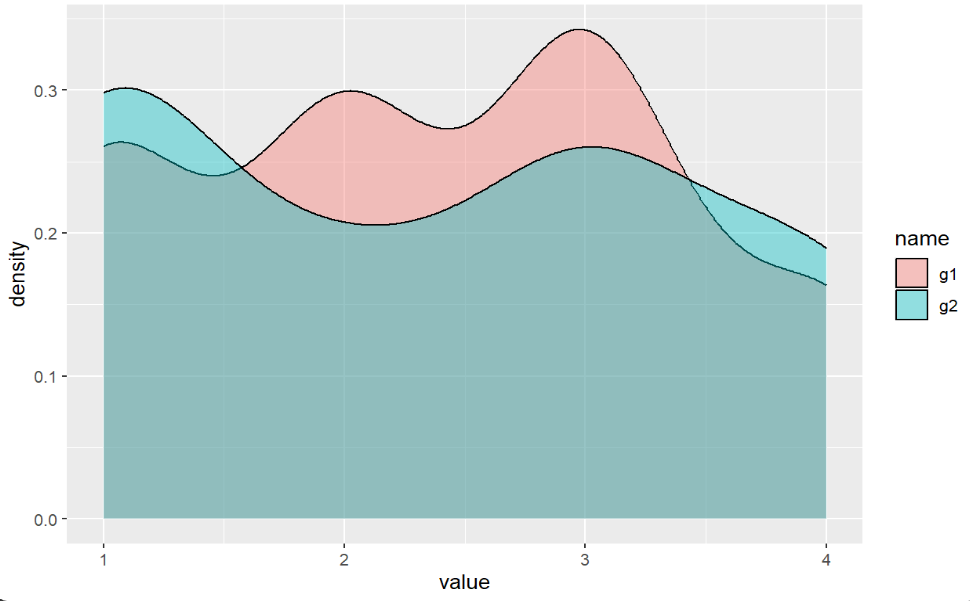
As alluded to in the comments, the typical parametric version of the t-test relies on some assumptions of the data before running them. One of these assumptions is that of normality. Most Likert scale data is non-normally distributed (Delacre et al., 2017), so it is likely your data is the same. Considering your sample is on the smaller side, I would imagine this would be more likely to be the case here. For example, I can randomly sample data with 4 arbitrary values with $n=40$ and commonly see non-normal distributions like that below:
#### Simulate Data ####
library(tidyverse)
set.seed(123)
g1 <- sample(1:4,40,replace = T)
g2 <- sample(1:4,40,replace = T)
df <- data.frame(g1,g2) %>%
  as_tibble() %>%
  pivot_longer(cols=1:2)
df

#### Plot ####
df %>%
  ggplot(aes(x=value,
             fill=name))+
  geom_density(alpha = .4)
Alternative
Because of this issue and your concern for outliers, you may need to consider a non-parametric version of the test, as the results will be biased otherwise. You may consider using the Welch t-test, which simulations have shown functions well with both non-normal and homoscedastic distributions. (Delacre et al., 2017). It's unlikely your concerns with outliers will actually be remediate with more items, as at least one study with a robust sample showed that increasing items beyond 5 does very little to improve precision in testing (Simms et al., 2019).
References
- Delacre, M., Lakens, D., & Leys, C. (2017). Why psychologists should by default use Welch’s t-test instead of Student’s t-test. International Review of Social Psychology, 30(1), 92. https://doi.org/10.5334/irsp.82
- Simms, L. J., Zelazny, K., Williams, T. F., & Bernstein, L. (2019). Does the number of response options matter? Psychometric perspectives using personality questionnaire data. Psychological Assessment, 31(4), 557–566. https://doi.org/10.1037/pas0000648
-
1$\begingroup$ Unless the Likert data are extraordinarily skewed, the t-test will be fine. The crux of the matter concerns the meaning of its null hypothesis, because performing arithmetic operations on ordinal data can be questionable and, at the very least, raises the question of what those operations mean. $\endgroup$– whuber ♦Commented Jun 29, 2023 at 14:07
-
$\begingroup$ What in particular are you alluding to in terms of questionable arithmetic operations? $\endgroup$ Commented Jun 29, 2023 at 14:13
-
$\begingroup$ The values on this scale are defined only up to the application of any increasing function $f.$ When $f$ is nonlinear and $(x_1,\ldots, x_n)$ is a set of data with arithmetic mean $\bar x,$ then (writing $y_i=f(x_i)$) usually $f(\bar x)\ne \bar y.$ Thus, comparing means (which is how the hypotheses in any t-test are formulated) is inherently meaningless. $\endgroup$– whuber ♦Commented Jun 29, 2023 at 14:19
-
$\begingroup$ I suppose I'm ignorant to how nonlinearity works with this type of data. I'm familiar with how this would work with two numeric variables, but not with factors used in a t-test. Perhaps you could elucidate what you mean in an answer and I can correct my answer accordingly? $\endgroup$ Commented Jun 29, 2023 at 14:35
-
$\begingroup$ I think the question isn't really about a t-test: it's about the effects of using a coarse scale, such as a four-point scale, instead of a finer 11-point scale on identifying "outliers." There's a basic question about what "outlier" might mean, too. $\endgroup$– whuber ♦Commented Jun 29, 2023 at 14:50

