2
$\begingroup$

The plot below shows the ecdf of the p-values from to different statistics, let us identify the blue graph as vector x and the red graph as vector y. Now I execute a ks.test for x and y compare these vectors with a uni distribution in a small range.

ks.test(x[x<=0.2],function(x){punif(x,0.01,0.2)},alternative = "two.sided")
ks.test(y[y<=0.2],function(x){punif(x,0.01,0.2)},alternative = "two.sided")

Now I get better values for the blue-line but it's obviously that the red-line should be a better fit. If I watch closer to the values in x and y I get only 26 values in x and more than 1500 in y. So I think, the reason why the ks.test gives a better p-value for the blue-line depends on the low number of relevant points in x.

The values in x and y comes from a simulation. Schould I increase the number of simulated experiments?
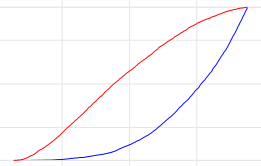
ecdf

$\endgroup$

1 Answer 1

2
$\begingroup$

It seems like the most straightforward solution to your problem is to match the number of simulated experiments in x and y. You will tend to see lower p-values when N is higher because the test has more power and it is seldom the case that our data perfectly match the null hypothesis.

$\endgroup$
5
  • $\begingroup$ But I cant decide which elments I should use from y in the range [0,0.2]? $\endgroup$
    – Klaus
    Commented Jul 23, 2013 at 13:43
  • $\begingroup$ has someone any idea? $\endgroup$
    – Klaus
    Commented Jul 23, 2013 at 17:24
  • $\begingroup$ So can I compare the following tests? len<-length(x[x<=0.2]) rb<-y[len] length(y[y<=0.2]) ks.test(x[x<=0.2],function(x){punif(x,0.0,0.2)},alternative = "two.sided") ks.test(y[1:len],function(x){punif(x,0.0,rb)},alternative = "two.sided") $\endgroup$
    – Klaus
    Commented Jul 23, 2013 at 20:34
  • $\begingroup$ Well... in principle you could... I guess. It seems like a lot of data to throw away. But since you're doing this over and over again over a lot of tests and building the ecdf as you go and you aren't really doing a statistical test to compare the two results... sure? Why not? Just in case there are sequential dependencies, I'd recommend that you call ks.test[y[sample(1:length(y),len)], function (x) {blahblah}) $\endgroup$ Commented Jul 23, 2013 at 23:24
  • $\begingroup$ Yes, I simulate 10000 experiments, for each I do a calculation on two differnt statistics, $T_1$ and $T_2$ and I assume a distribution for this statistics. Under this assumption I calculated the p-values for each experiment for each statistic. After that, I like to compare the p-values in a small range, e.g. between [0,0.2]. But I dont repeat this process more then once, I dont realy get what you guess. $\endgroup$
    – Klaus
    Commented Jul 24, 2013 at 8:02

Your Answer

By clicking “Post Your Answer”, you agree to our terms of service and acknowledge you have read our privacy policy.

Not the answer you're looking for? Browse other questions tagged or ask your own question.