0
$\begingroup$

I am testing the output of a low-power cell battery and then I measured the output after a while. I did multiple runs and the output was slightly different every time. I would like to check whether my collected data are aligned with the population and show that my output measurements are reliable and consistent. The standard is to show a P-value of P < 0.05.

My approach (MATLAB):

mu = 2.366;     % Population mean 
sample=[2.180213,2.178298   ,2.310851   ,2.114255   ,3.012553   ,2.69234    ,2.079787];
n = numel(sample);
[h,ptest] = ttest(sample,mu,0.05,'right')

(NOTE: all values are in micro *10^-6)

I am getting a value of p = 0.49 & h = 0. h = 0 indicates that ttest does not reject the null hypothesis at the 5% significance level.

Is there something I am doing wrong or are those the right p & h values for my output? can I reduce the sensitivity for my test to get better results?

$\endgroup$
4
  • 1
    $\begingroup$ I think you should clarify first your null hypothesis... it seems that you are more looking for equivalence testing. See answer from @Spätzle: stats.stackexchange.com/a/535387/321901 $\endgroup$
    – Pitouille
    Commented Sep 15, 2021 at 14:17
  • 1
    $\begingroup$ Yes, it is equivalence testing. $\endgroup$ Commented Sep 15, 2021 at 14:28
  • 1
    $\begingroup$ I second stating what your null and alternative hypotheses would be. Since you're doing equivalence testing, it would be okay to state more usual hypotheses where we would like to "prove" the null, and then we can figure out how to reverse the hypotheses for an equivalence test. // I think you want to examine the variance, not the mean, but perhaps I am incorrect about this. $\endgroup$
    – Dave
    Commented Sep 15, 2021 at 14:54
  • $\begingroup$ I thought we should examine the mean or one of the values I have as the hypothesis condition. I pretty much want to say "this is my ideal output, are the other values close enough to it?" $\endgroup$ Commented Sep 15, 2021 at 15:43

2 Answers 2

1
$\begingroup$

I think that you are carrying out the wrong test for your real hypothesis. From your comments, you want to show that your numbers are "close together" and not "far apart". This is a statement about the standard deviation, not the mean. Your test right now can only tell you about the mean and not about the standard deviation. Let me give you two examples:

2.369 2.384 2.373 2.361 2.362 2.356 2.356 (mean = 2.366, standard deviation = 0.01)

4.478 0.358 3.375 3.559 1.632 2.430 0.730 (mean = 2.366, standard deviation = 1.54)

I'm guessing that you would find the first sample "acceptably close together" and the second "too far apart". If this is right, you'll need to do a chi-square test for standard deviation.

Your next steps are:

  1. Decide how large a standard deviation is acceptable to you (0.01? 0.1? 0.5?). Note that you CANNOT get this from your sample data. It needs to be a number that you choose for reasons other than the data you collected.
  2. Carry out a one-sided chi-square test with H0: standard deviation >= X vs HA: standard deviation < X, where X is the largest standard deviation you would be happy with.
  3. If you reject the null hypothesis with p < 0.05, you can say your battery power outputs are sufficiently consistent for you.

Unfortunately I am not familiar with MATLAB and so can't implement step 2, but hopefully this gives you a better idea on what to search for.

$\endgroup$
3
  • $\begingroup$ makes sense. I will see If I can implement this in MATLAB $\endgroup$ Commented Sep 15, 2021 at 16:49
  • $\begingroup$ Thank you, I figured it out $\endgroup$ Commented Sep 16, 2021 at 0:20
  • $\begingroup$ The chi-square test of variance (stats.stackexchange.com/questions/464023/chi-square-test) will test the variance/standard deviation indeed... however, you can have samples with different means and similar standard deviations... So, you won't achieve equivalence with such a test without validating also its central tendency. $\endgroup$
    – Pitouille
    Commented Sep 21, 2021 at 6:45
6
$\begingroup$

To answer the first part of your question, i.e. what you are doing wrong. In your example, you are testing the following hypotheses:

$H_0: \mu_s \le \mu$ and $H_1: \mu_s > \mu$ where $\mu = 2.366$

In other words, you are trying to accept the alternative hypothesis that states that the true mean is greater than 2.366... but you failed to reject the null hypothesis (which states that the true mean is less or equal to 2.366)!

EDIT FOR FUTURE READERS INTERESTED BY THIS QUESTION

Comments on (accepted) answer proposed by @user334895: testing variance does not lead to equivalence. The collected information could have a different mean but a similar variance and, therefore, lead to an incorrect conclusion.

What is implied in this answer is that if the mean of the obtained sample is very close to the population mean, then we only need to test the variance of the sample to conclude to equivalence. The problem is that it is actually a mix of descriptive statistics (use of the sample mean and assume it is equal the true population mean) and inferential statistics (testing variance to draw conclusion about the population variance).

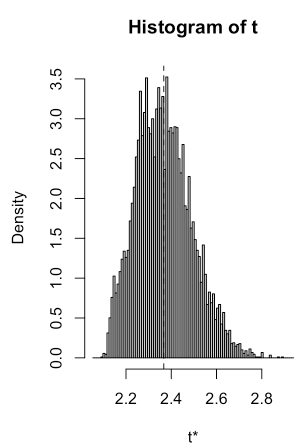
However, the obtained sample is one possible out of many others, so there is no certainty about its mean. Based on the sample we have, we can empirically illustrate/simulate this sampling distribution of the sample means with bootstrap:

enter image description here

A mean of 2.6 is also possible for example, so the variance test is no longer valid in this scenario because even if variance matches the target, the data collected will differ from the population mean.

An approach to solve this problem would be to run a TOST (Two-One-Sided T-test) procedure (equivalence testing). It is already well documented on this site https://stats.stackexchange.com/a/500121/321901.

$\endgroup$
6
  • $\begingroup$ I thought what I was doing was stating that the true mean is equal to 2.366 (not greater!). How do I modify it on MATLAB to be only equal? $\endgroup$ Commented Sep 15, 2021 at 15:49
  • $\begingroup$ I am not a matlab specialist but it looks like the "right" parameter means that you are doing a one-tailed test. If you set your parameter to equal (if this is the syntax in matlab), you will be in a position where you fail to reject the null hypothesis... but it does not mean that you can accept your null hypothesis neither... $\endgroup$
    – Pitouille
    Commented Sep 15, 2021 at 15:55
  • $\begingroup$ So, h = 0 indicates that ttest does not reject the null hypothesis. In MATLAB: 'both' -- "mean is not M" (two-tailed test) 'right' -- "mean is greater than M" (right-tailed test) 'left' -- "mean is less than M" (left-tailed test) $\endgroup$ Commented Sep 15, 2021 at 16:02
  • $\begingroup$ If you are doing a two-tailed test, you will test the following hypotheses: $H_0: \mu_s = \mu$ and $H_1: \mu_s \neq \mu$. But failing to reject the null hypothesis does not achieve what you want... hence equivalence testing was brought to the discussion. $\endgroup$
    – Pitouille
    Commented Sep 15, 2021 at 16:08
  • $\begingroup$ Thanks, I figured it out $\endgroup$ Commented Sep 16, 2021 at 0:19

Your Answer

By clicking “Post Your Answer”, you agree to our terms of service and acknowledge you have read our privacy policy.

Not the answer you're looking for? Browse other questions tagged or ask your own question.