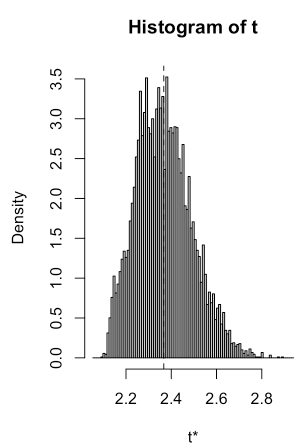
I am testing the output of a low-power cell battery and then I measured the output after a while. I did multiple runs and the output was slightly different every time. I would like to check whether my collected data are aligned with the population and show that my output measurements are reliable and consistent. The standard is to show a P-value of P < 0.05.
My approach (MATLAB):
mu = 2.366;     % Population mean
sample=[2.180213,2.178298   ,2.310851   ,2.114255   ,3.012553   ,2.69234    ,2.079787];
n = numel(sample);
[h,ptest] = ttest(sample,mu,0.05,'right')
(NOTE: all values are in micro *10^-6)
I am getting a value of p = 0.49 & h = 0. h = 0 indicates that ttest does not reject the null hypothesis at the 5% significance level.
Is there something I am doing wrong or are those the right p & h values for my output? can I reduce the sensitivity for my test to get better results?

