2
$\begingroup$

I am using logistic regression for a problem and a colleague suggested trying a MLE solution, with the assumption that some of my features $X_i$ may not have a linear relationship with the target variable $Y_i$.

So his idea is that I take my features (assume they are continuous) and "bin" them into $N_i$ buckets. Then calculate the proportions of members of the positive and negative classes that fall into each bucket, which gives a sort of non-parametric likelihood distribution (not sure if that's the right term to be honest). Once these nonparametric distributions are calculated, I could then calculate the likelihood ratio for a new (test) instance.

Having said all that, I was hoping I could find some references that illustrate this approach more formally than the mental model I currently have. Also, simply, does it make sense to do this kind of model? I don't want to spin my wheels. Are there any pitfalls I should look out for?

Also, I guess one question is whether I should just be using Random Forest? Wouldn't that be able to capture non-linearities just as well as the above approach?

$\endgroup$
5
  • 1
    $\begingroup$ This isn't an answer to your main question, but if you've got all continuous features you might find splines or generalized additive models (GAMs) to be a nice middle ground between flexibility and interpretability. Also re: binning, definitely give this a good read before doing so: stats.stackexchange.com/questions/68834/…. Also maximum likelihood by itself doesn't mean you do or don't have a parametric linear model, deep neural networks can be fit via maximum likelihood but so is logistic regression $\endgroup$
    – jld
    Commented Mar 8, 2018 at 3:39
  • $\begingroup$ @Chaconne He wasn’t talking about MLE as a means to solve NN or logistic regression or some other model. Specifically he meant using it as the model itself in a non-parametric way. Just taking the likelihood ratios between the positive and negative samples in the binned variables. I’m finding it hard to explain, which is why I’m trying to find some more grounded references for this approach. $\endgroup$
    – thecity2
    Commented Mar 8, 2018 at 3:48
  • $\begingroup$ is this for prediction only or also inference? And how exactly do you plan on applying this model to a new data point? Let's say you want to make a prediction for a new point $x_0$. Once binned into $\tilde x_0$, say, do you then have basically a big lookup table and you find the cell corresponding to exactly $\tilde x_0$ and you return the proportion of $y=1$ in your data for all observations that fell in that cell (i.e. when binned they are exactly equal to $\tilde x_0$)? $\endgroup$
    – jld
    Commented Mar 8, 2018 at 4:34
  • $\begingroup$ @Chaconne Our primary objective is to improve prediction. As for the question, that is really why I'm here. What you proposed is essentially what it seems like he was suggesting to me or something like it. For positive and negative outcomes there would be some likelihood ratio based on the proportions found in training data. Does that make sense? Like I said, I'm here because it's not something I've really seen before. $\endgroup$
    – thecity2
    Commented Mar 8, 2018 at 4:38
  • $\begingroup$ thanks for all of the extra info (and +1, these kinds of questions are super important but hard to discuss when you don't know the answer already) $\endgroup$
    – jld
    Commented Mar 8, 2018 at 5:20

3 Answers 3

2
$\begingroup$

Without knowing the exact procedure in question it's a bit hard to critique, but at this point I'm pretty confident in saying that you have a lot of better tools at your disposal than what is being suggested and you'd be better off not doing it.

It sounds like you want to estimate the conditional distribution $P(Y=1 | X = x)$. A logistic regression does this by making additivity and linearity assumptions. You're considering an alternative approach where you change this from being continuous to instead being discrete, and then just use sample averages to estimate this probability within each cell of the $N_1 \times \dots \times N_p$ grid that now supports your distribution.

If that's really the proposed estimator, there are a number of fatal flaws. First, how could you produce an estimate for a new point that's not exactly like other ones you saw? Second, the vast majority of cells will be completely empty, and the ones that aren't will probably only have a couple of data points. Each individual cell's estimates will be terrible.

The only way to save this is to make some structural assumptions like independence, so you can attempt to recreate this joint distribution using lower-variance marginal information (I believe one such method is iterative proportional fitting where you use lower dimensional marginals to approximate a joint distribution table). This could also be done by fitting a logistic regression on the binned features, where now we can estimate each cell's probability by pooling information and we've made simplifying assumptions about the distribution.

But now we're just going back to where we started, and I think we're worse off than if we didn't bin at all and just fit a more flexible model. Binning is generally a bad idea: don't do it unless you have to (like if there are industry requirements or something).

From what you've described I'm not sure how this is different from any other black box machine learning prediction problem, so unless there's something I'm missing there's really no need to cook up something new and questionable here. Continuous features are fantastic for fitting flexible models. If you mainly care about prediction why not use that random forest? That's perfect for this sort of thing. Or use a GAM, Gaussian process, or any other appropriate model that you like.

It's definitely possible that I've missed something here, and what with no free lunch it's not guaranteed that this model would perform poorly in your setting, but I wouldn't bet on it doing well.

$\endgroup$
2
  • $\begingroup$ More I think about it seems like he was essentially suggesting a GAM but like a poor man’s version without any smoothing. $\endgroup$
    – thecity2
    Commented Mar 8, 2018 at 17:22
  • $\begingroup$ @thecity2 if you're mainly interested in prediction you could probably just compare these methods via test sets or cross validation like you would any other candidate models. I'd bet a smoothed GAM with no binning will have better out-of-sample performance but there's no reason to guess if you can actually measure it. $\endgroup$
    – jld
    Commented Mar 8, 2018 at 17:57
1
$\begingroup$

Hoping I could find some references that illustrate this approach more formally than the mental model I currently have

I think there are a lot of research papers addressing the binning of continuous variables (here's one: http://www.m-hikari.com/ams/ams-2014/ams-65-68-2014/zengAMS65-68-2014.pdf), however this approach is relatively rare (at least in my opinion) in machine learning approaches due to much more manual work needs to be done to create great binning.

Binning is usually (very often) used in actuarial credit, risk, premium models due to the nature that the industries are highly regulated and the model output need to make sense, especially since the most popular model in actuarial science is logistic regression, the linearity relationship between each variable in the model and the reponse need to be assessed with much much more care. And the approach is binning to create reasonable nominal variables to find the best linear relationship between the variables.

It also serves as a way to reduce the effect of extreme values as well.

However, the downside is that it will really take your time to assess each variable to create bins. And this needs to be done back and forth for all variables in your model.

Whether I should just be using Random Forest?

Short answer, you can. If you have no restrictions on which model to use, random forest will typically give you better result as it will handle the non-linearity of your data. However, this is going to reduce the interpretability of your model output compare to logistic regression; if this doesn't matter to you, go ahead.

$\endgroup$
0
$\begingroup$

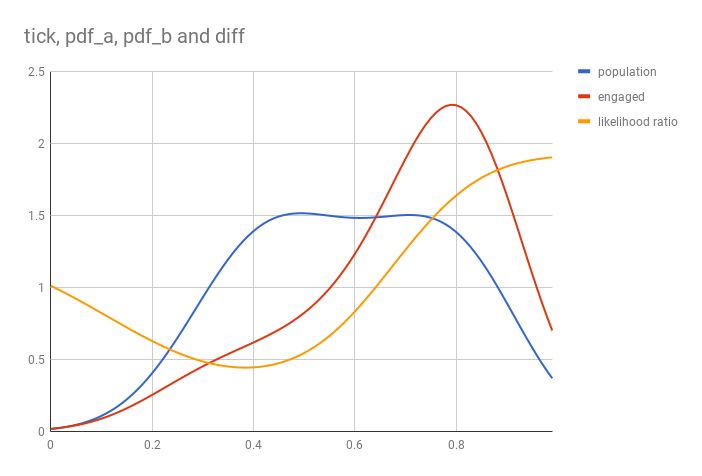
So I gave this a go and found that I could use a kernel density estimator to calculate smooth pdf for the two populations. I can do this for each feature and then rank test points by summing the log likelihoods for each feature. I imagine this could theoretically work well if the smoothing is chosen using cross-validation and there is enough "weirdness" in the distributions that simpler linear classifiers don't capture.

Edit: I came to the realization that this is essentially Naive Bayes with non-parametric features.

distributions

For reference: https://stephens999.github.io/fiveMinuteStats/likelihood_ratio_simple_continuous_data.html

$\endgroup$

Your Answer

By clicking “Post Your Answer”, you agree to our terms of service and acknowledge you have read our privacy policy.

Not the answer you're looking for? Browse other questions tagged or ask your own question.