1
$\begingroup$

(I've posted this on StackOverflow--visualization--but got no response yet, so I'm trying to cross post here in the hope that more people with statistical and math knowledge can help make suggestion)

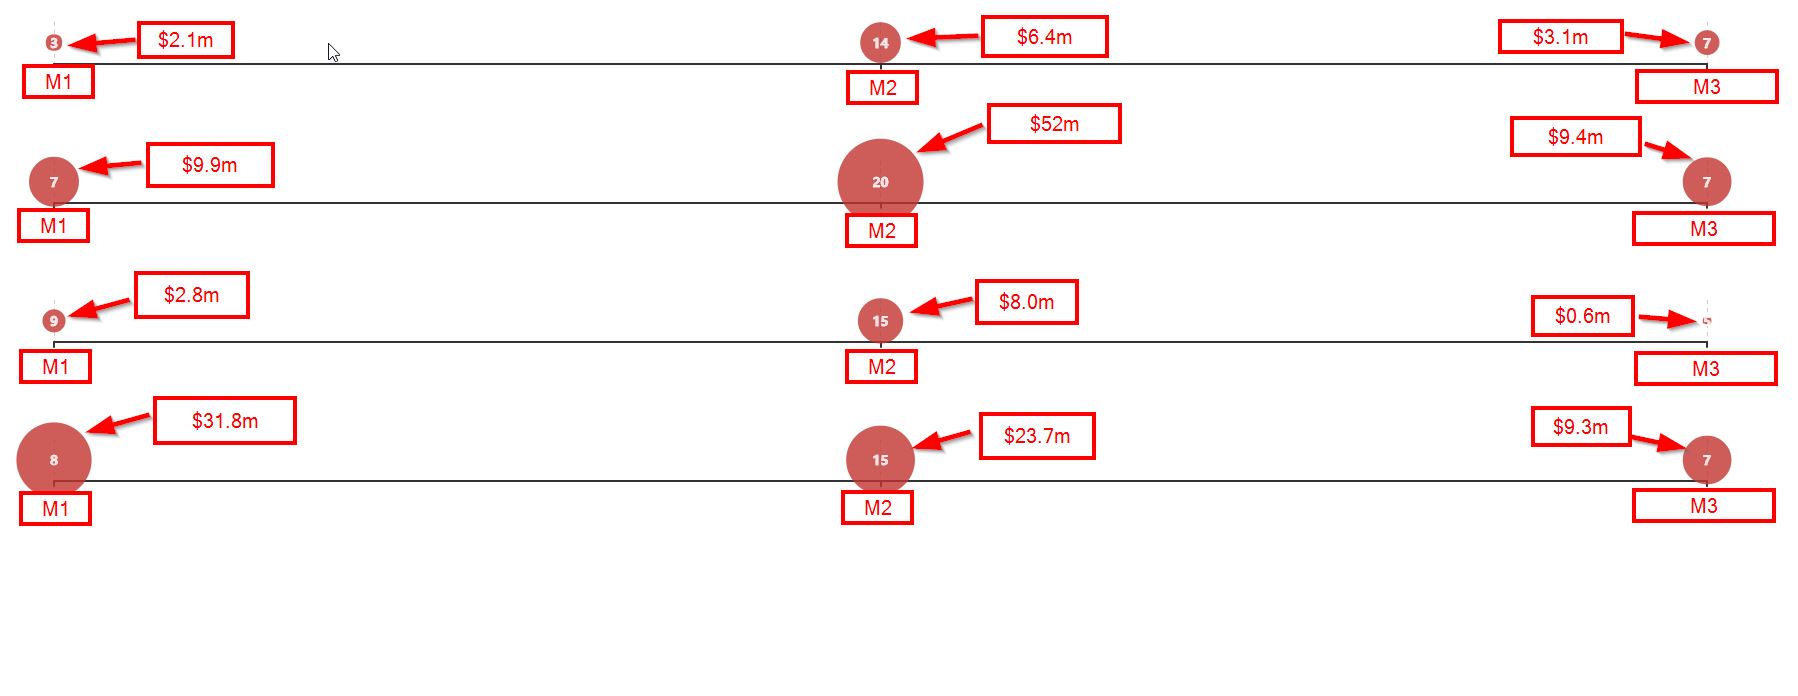
I am using a bubble chart to represent, the amount spent by members of a population on M1, M2 and M3 as follows:

enter image description here

Note: In the above figure, each row of axis represent individual member, and the size of the bubbles on a line represents the amount spent on M1,M2 and M3 respectively by that member. Also, please ignore the numbers showing up inside each bubble. That represents another metric not relevant to this question.

Currently, I'm using a logarithmic function (thanks to another StackOverflow post here) to scale the size of the bubbles. The function is like this:

    function scaledValue(value) {
        var minp = 0;
        var maxp = 100;

        var minv = Math.log(1000000);
        var maxv = Math.log(100000000);

        var scale = (maxv-minv) / (maxp-minp);

        return (Math.log(value)-minv) / scale + minp;
    }

Because I'm using the log scale, the size of some bubbles aren't quite proportionate to look at. For example, the bubble that represents $52m is not quite as big as it should be compared to $9.4m bubble. On the other hand, the bubbles for $3.1m vs. $9.4m look reasonable relative to each other.

One might ask, "Why are you using log scale then?!" The reason I use log scale is because the underlying spend numbers are quite spread out as follows:

min = $0
max = $272,000,000
avg = $4,000,000
stddev = $17,000,000
number of total data points = 1609

So when I used linear scale, the size of the bubbles goes out of whack (meaning some are too small to see; some are too big that they engulf the whole plot).

My question to more mathy folks here is what kind of scale will allow users to easily discern the relative size of the underlying values more accurately than logarithmic scale.

$\endgroup$
4
  • $\begingroup$ I'm voting to close this question as off-topic because it has been cross posted $\endgroup$
    – Peter Flom
    Commented Jun 9, 2018 at 14:28
  • $\begingroup$ @PeterFlom Isn't 'visualizing data' part of the topics in the help center? $\endgroup$ Commented Jun 9, 2018 at 16:06
  • $\begingroup$ I closed it because it was cross posted. That's against the rules. $\endgroup$
    – Peter Flom
    Commented Jun 11, 2018 at 11:19
  • $\begingroup$ @PeterFlom I assume you are referring to my question posted in the math StackOverflow (SO)? I removed it just now since it received no responses. Btw, cross-posting is only discouraged (it's not a rule), and please keep in mind that, sometimes we, as questioners, decide to post in another branch of SO because we received no response for the same question in a different branch. Also, it is hard to judge sometimes where to post in questions like this because it straddles between visualization and math/statistics. I hope you, as an seasoned SO contributor, would understand. $\endgroup$ Commented Jun 11, 2018 at 14:17

2 Answers 2

4
$\begingroup$

First off, since you are most likely specifying the radius or diameter of the bubble, you need to take the square root of the number first. A bubble with r=2 is four times as large as one with r=1. That alone will bring some things into scale.

But, if you them take a log, you are doing something arbitrary. Log scales work, for example, on line graphs, because then each unit (in inches or mm) represents the same percentage change everywhere on the graph (e.g., the graph y = x^2 is a straight line). Using a log just to rescale gives you bubbles that mean nothing to the observer.

$\endgroup$
6
  • $\begingroup$ Thanks for the reply. What you said make sense. Supposed that I want to map the value between $0 - $272,000,000 to 20 and 100, is there a linear function that would allow me to accomplish that? Thanks again. $\endgroup$ Commented Jun 8, 2018 at 20:59
  • 1
    $\begingroup$ Sure, and you should see it. you want to map to [20, 100] from [0, 272,000]. Call the first range X and the second Y. It is obvious the linear map = $Y = (X+20)$ must be part of it, since when $y=0$ we need to have $X=20$ . So, it must look like $Y=(X+20) \cdot k$, for some k which gets $Y_270,000 = 100$ $\endgroup$
    – eSurfsnake
    Commented Jun 12, 2018 at 4:35
  • 1
    $\begingroup$ [timed out...cont'd...] ...So, it must look like $Y=(X+20) \cdot k$, for some k which gets $Y_{270,000} = 100$, which you can solve. $\endgroup$
    – eSurfsnake
    Commented Jun 12, 2018 at 4:43
  • 1
    $\begingroup$ got it from here? Just imagine converting as Farenheit to Celsius... $\endgroup$
    – eSurfsnake
    Commented Jun 12, 2018 at 4:55
  • 1
    $\begingroup$ I'm really happy that my advice was helpful to you, and it is very kind of you to provide that feedback. I wish you great success with your efforts. $\endgroup$
    – eSurfsnake
    Commented Jun 14, 2018 at 4:12
2
$\begingroup$

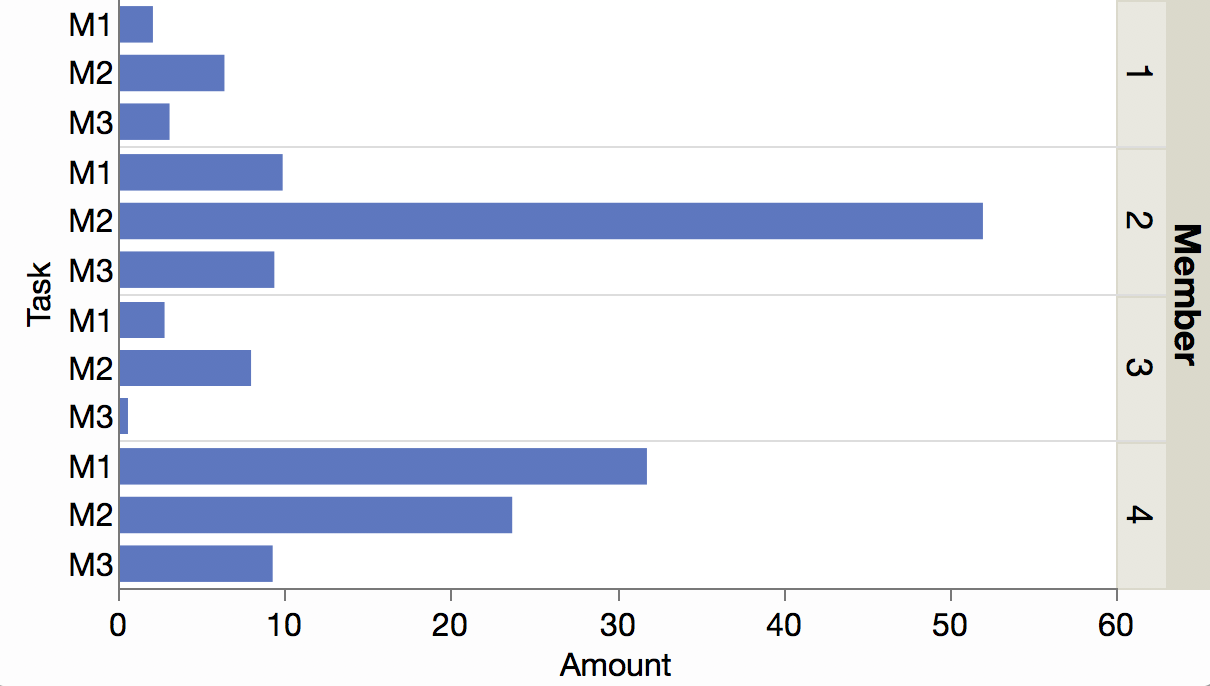
Your range of values (within 100:1 ratio) is not so extreme that you can't use a natural scale on a single axis with a dot chart or bar chart.

enter image description here

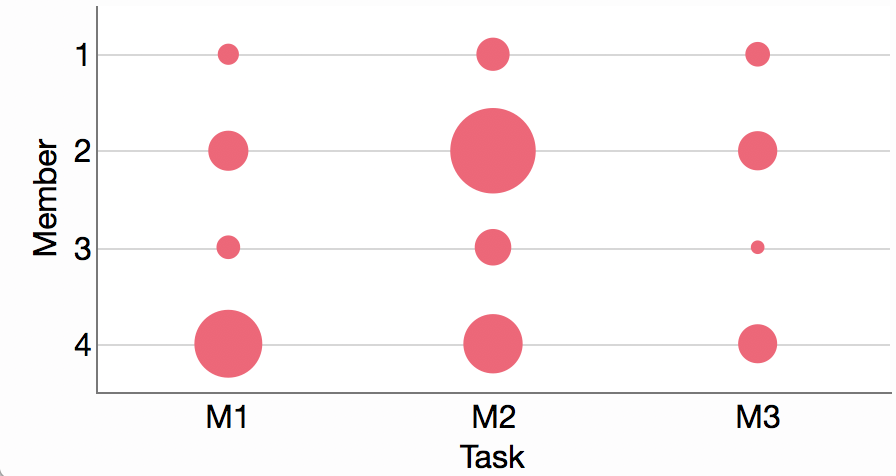
Using area (such as your bubbles or a treemap), you can usually represent a greater range of values (say, 1000:1 ratio) in the same space since they use two dimensions to represent the values. However, comparisons are more difficult to judge.

enter image description here

For wider ranges, you may have to revert to some transformation like log or quantile. Those will distort the value interpretation but do preserve the relative rankings.

A log transformation would be natural if you cared more about multiplicative differences. That is, if the difference between 1 and 5 is equally important as the difference between 10 and 50, since they both differ by a multiple of 5.

Here's the data I used if anyone wants to experiment.

Task,Member,Amount
M1,1,2.1
M2,1,6.4
M3,1,3.1
M1,2,9.9
M2,2,52
M3,2,9.4
M1,3,2.8
M2,3,8
M3,3,0.6
M1,4,31.8
M2,4,23.7
M3,4,9.3
$\endgroup$
1
  • $\begingroup$ Thank you for a very helpful answer! I learned more about how to visualize different sort of data and esp. about what happens when we use log scale. I have not thought of 'Quantile' and would be giving it a try. :) I too believe bubble chart is a poor choice here, but it's my client who wants it that way, so I can only suggest much... Thanks again! $\endgroup$ Commented Jun 9, 2018 at 16:08

Not the answer you're looking for? Browse other questions tagged or ask your own question.