24
$\begingroup$

I am performing $N$ independent statistical tests with the same null hypothesis, and would like to combine the results into one $p$-value. It seems that there are two "accepted" methods: Fisher's method and Stouffer's method.

My question is about Stouffer's method. For each separate test I obtain a z-score $z_i$. Under a null hypothesis, each of them is distributed with a standard normal distribution, so the sum $\Sigma z_i$ follows a normal distribution with variance $N$. Therefore Stouffer's method suggests to compute $\Sigma z_i / \sqrt{N}$, which should be normally distributed with unit variance, and then use this as a joint z-score.

This is reasonable, but here is another approach that I came up with and that also sounds reasonable to me. As each of $z_i$ comes from a standard normal distribution, the sum of squares $S=\Sigma z^2_i$ should come from a chi-squared distribution with $N$ degrees of freedom. So one can compute $S$ and convert it to a $p$-value using cumulative chi-squared distribution function with $N$ degrees of freedom ($p=1−X_N(S)$, where $X_N$ is the CDF).

However, nowhere can I find this approach even mentioned. Is it ever used? Does it have a name? What would be advantages/disadvantages compared to Stouffer's method? Or is there a flaw in my reasoning?

$\endgroup$
9
  • $\begingroup$ One salient flaw that jumps out is Stouffer's method can detect systematic shifts in the $z_i$, which is what one would usually expect to happen when one alternative is consistently true, whereas the chi-squared method would appear to have less power to do so. A quick simulation ($N=100$, $10^4$ iterations) shows this to be the case; the chi-squared method is seriously less powerful to detect a one-sided alternative. $\endgroup$
    – whuber
    Aug 1, 2013 at 22:20
  • 2
    $\begingroup$ Thanks, whuber! Could you describe your simulation in more detail, I am curious. On the other hand, if $z_i$ have different signs but large absolute values, then Stouffer's method can end up with overall $z \approx 0$, whereas my method would report a VERY significant $p$. I guess in some cases it can make much more sense (and I suspect in my case it does, but I am not sure). $\endgroup$
    – amoeba
    Aug 1, 2013 at 22:27
  • 1
    $\begingroup$ You are right, which is why I did not post my comment as an answer. But what kinds of situations are there where the alternatives vary so radically from the null in both directions, except due to chance alone? $\endgroup$
    – whuber
    Aug 1, 2013 at 22:33
  • $\begingroup$ The situation I had in mind is something like the one in Pearson's chi-squared test, where one is interested in whether an empirical distribution differs from the null; then deviations in either direction matter. But after giving it a second thought, I guess your intuition is correct and in my case suspicious deviations are all in one direction. If you post your comment as an answer and provide some details on your quick simulation (I am very curious why the chi-squared method turns out to be less powerful!), I will be happy to accept it. $\endgroup$
    – amoeba
    Aug 1, 2013 at 22:45
  • $\begingroup$ The sum of n Z scores has a distribution with a variance of n? Why isn't the variance the square of the standard error of the mean? The sum of $Z^2$ as implied in the title does have a variance of N. Maybe I'm missing something obvious? $\endgroup$ Aug 1, 2013 at 23:49

4 Answers 4

19
$\begingroup$

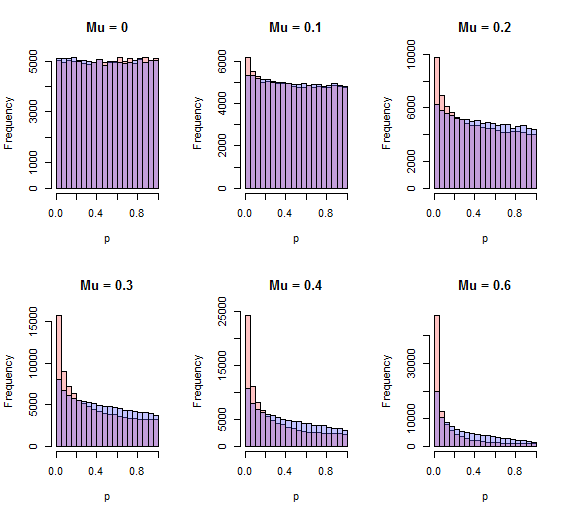
One flaw that jumps out is Stouffer's method can detect systematic shifts in the $z_i$, which is what one would usually expect to happen when one alternative is consistently true, whereas the chi-squared method would appear to have less power to do so. A quick simulation shows this to be the case; the chi-squared method is less powerful to detect a one-sided alternative. Here are histograms of the p-values by both methods (red=Stouffer, blue=chi-squared) for $10^5$ independent iterations with $N=10$ and various one-sided standardized effects $\mu$ ranging from none ($\mu=0$) through $0.6$ SD ($\mu=0.6$).

Figure

The better procedure will have more area close to zero. For all positive values of $\mu$ shown, that procedure is the Stouffer procedure.


R code

This includes Fisher's method (commented out) for comparison.

n <- 10
n.iter <- 10^5
z <- matrix(rnorm(n*n.iter), ncol=n)

sim <- function(mu) {
  stouffer.sim <- apply(z + mu, 1, 
                    function(y) {q <- pnorm(sum(y)/sqrt(length(y))); 2*min(q, 1-q)})
  chisq.sim <- apply(z + mu, 1, 
                    function(y) 1 - pchisq(sum(y^2), length(y)))
  #fisher.sim <- apply(z + mu, 1,
  #                  function(y) {q <- pnorm(y); 
  #                     1 - pchisq(-2 * sum(log(2*pmin(q, 1-q))), 2*length(y))})
  return(list(stouffer=stouffer.sim, chisq=chisq.sim, fisher=fisher.sim))
}

par(mfrow=c(2, 3))
breaks=seq(0, 1, .05)
tmp <- sapply(c(0, .1, .2, .3, .4, .6), 
              function(mu) {
                x <- sim(mu); 
                hist(x[[1]], breaks=breaks, xlab="p", col="#ff606060",
                     main=paste("Mu =", mu)); 
                hist(x[[2]], breaks=breaks, xlab="p", col="#6060ff60", add=TRUE)
                #hist(x[[3]], breaks=breaks, xlab="p", col="#60ff6060", add=TRUE)
                })
$\endgroup$
6
  • $\begingroup$ Thanks again, this is very nice. And what happens if you uncomment Fisher's method? I suspect you have already tried it. Does Stouffer consistently win? (Sorry for not trying it out myself, but I have no experience with R and do not have it at hand.) $\endgroup$
    – amoeba
    Aug 1, 2013 at 23:48
  • $\begingroup$ Update: regarding comparison between Fisher's and Stouffer's methods I found a nice discussion here. The claim is that Stouffer is more sensitive to consistent deviations from null, whereas Fisher is more sensitive to single (but large) deviations. I guess in your simulation you had consistent deviations ($\mu$ the same in all $N$ tests), correct? I wonder what would happen if only 1 out of $N$ tests shows a strong deviation. $\endgroup$
    – amoeba
    Aug 2, 2013 at 9:56
  • 1
    $\begingroup$ You could easily modify the R simulation to test this. It would be a good way to introduce yourself to this statistical computing platform. :-) $\endgroup$
    – whuber
    Aug 2, 2013 at 13:54
  • 2
    $\begingroup$ I used matlab to reproduce your simulation. Conclusions: when all $z_i$ deviate consistently from 0, then Stouffer wins over Fisher with a small margin and "my" method looses hopelessly (as you showed). When only one of $z_i$ deviates a lot from 0, then Fisher wins over "my" method with a small margin and Stouffer loses hopelessly. $\endgroup$
    – amoeba
    Aug 2, 2013 at 14:41
  • $\begingroup$ Great discussion and QA! One quick question: what if one forms this problem as an outlier/anomaly detection by calculating Mahalanobis distance and follow something like this? $\endgroup$
    – NULL
    Apr 29, 2018 at 3:51
12
$\begingroup$

One general way to gain insight into test statistics is to derive the (usually implicit) underlying assumptions that would lead that test statistic to be most powerful. For this particular case a student and I have recently done this: http://arxiv.org/abs/1111.1210v2 (a revised version is to appear in Annals of Applied Statistics).

To very briefly summarize (and consistent with the simulation results in another answer) Stouffer's method will be most powerful when the "true" underlying effects are all equal; the sum of Z^2 will be most powerful when the underlying effects are normally distributed about 0. This is a slight simplification that omits details: see section 2.5 in the arxiv preprint linked above for more details.

$\endgroup$
1
  • 3
    $\begingroup$ (+1) Somehow I thought I wrote it a long time ago, but it seems I did not: thanks a lot for registering here specifically to answer my question! I appreciate it. Section 2.5 in your paper is indeed very relevant. $\endgroup$
    – amoeba
    Nov 20, 2014 at 20:32
4
$\begingroup$

Slightly o/t: one of the issues with both these approaches is the loss of power due to the degrees of freedom (N for stouffer's; 2N for Fisher's). There have been better meta-analytical approaches developed for this, which you may want to consider (inverse-variance weighted meta-analysis, for example).

If you're looking for evidence of some alternative tests within a group, you may want to look at Donoho and Jin's higher criticism statistic: https://projecteuclid.org/euclid.aos/1085408492

$\endgroup$
0
1
$\begingroup$

To answer the question and for any further readers: is it ever used?, there is an exhaustive paper by Cousins (2008) on arXiv, which listed and reviewed a couple of alternative approaches. The proposed one does not seem to appear.

$\endgroup$
0

Your Answer

By clicking “Post Your Answer”, you agree to our terms of service and acknowledge you have read our privacy policy.

Not the answer you're looking for? Browse other questions tagged or ask your own question.