7
$\begingroup$

I have two questions about heteroscedasticity in multiple regressions.

  1. According to my trusty textbook (Using Multivariate Statistics 2007, p.127), it says that deviations from heteroscedasticity only reduce that statistical power of a test, rather than inflating the type I error rate (is this true?)

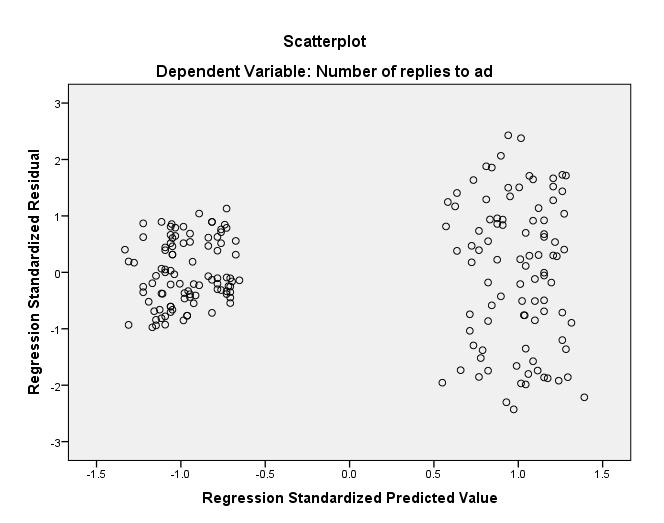
  2. I wanted to know if there were any guidelines about how to judge effect sizes for heteroscadisticity and how much is a bad effect size for it to matter (with N=187). Because I use two categorical variables, luckily my residual/predicted plot is in two distinct clumps that I can analyse (see below):

Multiple regression, three predictosrs, two categorical predictors. N=187

$\endgroup$
2
  • 2
    $\begingroup$ In real life problems heteroscedasticity could be the symptom of a more serious misspecification issue. For instance, it may indicate that you should be using unit root process instead of trend stationary. $\endgroup$
    – Aksakal
    Commented Jan 13, 2015 at 19:24
  • $\begingroup$ I don't have time to post this as an answer but point 1 is not necessarily true. Try this R code: x <- c(rep(0, 9), 1); y <- c(rnorm(mean=0, n=9, sd=1), rnorm(mean=0, n=1, sd=100)); summary(lm(y~x)). The conditional mean of y is 0 everywhere but the variance is much higher when x=1. I only put one point at x=1, you can see the results! $\endgroup$
    – Silverfish
    Commented Jan 13, 2015 at 19:37

1 Answer 1

5
$\begingroup$

It is true that heteroscedasticity reduce your power (see: Efficiency of beta estimates with heteroscedasticity), but it can also inflate type I errors. Consider the following simulation (coded in R):

set.seed(1044)                          # this makes the example exactly reproducible
b0 = 10                                 # these are the true values of the intercept
b1 = 0                                  #  & the slope
x  = rep(c(0, 2, 4), each=10)           # these are the X values
hetero.p.vector = vector(length=10000)  # these vectors are to store the results
homo.p.vector   = vector(length=10000)  #  of the simulation

for(i in 1:10000){                      # I simulate this 10k times
  y.homo   = b0 + b1*x + rnorm(30, mean=0, sd=1)  # these are the homoscedastic y's

  y.x0     = b0 + b1*0 + rnorm(10, mean=0, sd=1)  # these are the heteroscedastic y's
  y.x2     = b0 + b1*2 + rnorm(10, mean=0, sd=2)  #  (notice the SDs of the error
  y.x4     = b0 + b1*4 + rnorm(10, mean=0, sd=4)  #   term goes from 1 to 4)
  y.hetero = c(y.x0, y.x2, y.x4)

  homo.model         = lm(y.homo~x)               # here I fit 2 models & get the
  hetero.model       = lm(y.hetero~x)             #  p-values
  homo.p.vector[i]   = summary(homo.model)$coefficients[2,4]
  hetero.p.vector[i] = summary(hetero.model)$coefficients[2,4]
}
mean(homo.p.vector<.05)    # there are ~5% type I errors in the homoscedastic case
# 0.049                    #  (as there should be)
mean(hetero.p.vector<.05)  # but there are ~8% type I errors w/ heteroscedasticity
# 0.0804

Linear models (such as multiple regression), tend to be fairly robust, though. In general, a rule of thumb is that you are OK as long as the largest variance is not more than four times the lowest variance. This is a rule of thumb, so that should be taken for what it's worth. However, notice that in the simulation above, in the heteroscedastic model, the highest variance is $16\times$ the smallest variance ($4^2=16$, vs $1^2 = 1$) and the resulting type I error rate is $8\%$ instead of $5\%$.
$\endgroup$
2
  • $\begingroup$ Luckily i know a bit about R so I'll try and work through this example and understand it! My variance ratio between the two groups above is 2.3. If a natural log transform the dependant variable, i can reduce this to 1.68. Do you think its worth doing that, given that transformations also change our interpretation of the data? $\endgroup$ Commented Jan 13, 2015 at 19:44
  • $\begingroup$ @user3084100, it's hard to say in the abstract, but I doubt I would do that. A weighted least squares estimate is usually preferable. You may want to read my answer here: Alternatives to one-way ANOVA for heteroskedastic data, to get a sense of the options available. $\endgroup$ Commented Jan 13, 2015 at 19:52

Your Answer

By clicking “Post Your Answer”, you agree to our terms of service and acknowledge you have read our privacy policy.

Not the answer you're looking for? Browse other questions tagged or ask your own question.