12
$\begingroup$

If $X\in\mathbb{R}^n,~X\sim \mathcal{N}(\underline{0},\sigma^2\mathbf{I})$ i.e., $$ f_X(x) = \frac{1}{{(2\pi\sigma^2)}^{n/2}} \exp\left(-\frac{||x||^2}{2\sigma^2}\right) $$

I want an analogous version of a truncated-normal-distribution in a multivariate case.

More precisely, I want to generate a norm-constrained (to a value $\geq a$) multivariate Gaussian $Y$ s.t. $$ f_Y(y) = \begin{cases} c.f_X(y), \text{ if } ||y||\geq a \\[2mm] 0, \text{ otherwise }. \end{cases} $$ where $c=\frac{1}{Prob\big\{||X||\geq a\big\}}$


Now I observe the following:

If $x=(x_1,x_2,\ldots,x_n)$, $||x||\geq a$

$\implies |x_n|\geq T\triangleq \sqrt{\max\left(0,\left(a^2-\sum_1^{n-1}x_i^2\right)\right)}$

Therefore by choosing $x_1,\ldots,x_{n-1}$ as Gaussians samples, one may restrict $x_n$ as a sample out of a Truncated-normal-distribution (following a Gaussian-tail $\geq T$) distribution $\mathcal{N}_T(0,\sigma^2)$, except for its sign chosen randomly with probability $1/2$.

Now my question is this,

If I generate each vector sample $(x_1,\ldots,x_n)$ of $(X_1,\ldots,X_n)$ as,

$x_1,\ldots,x_{n-1}\sim \mathcal{N}(0,\sigma^2)$

and

$x_n = Z_1 *Z_2~$ where, $~Z_1\sim\{\pm1 ~\text{w.p.}~ 1/2\}$, $Z_2\sim\mathcal{N}_T(0,\sigma^2)$, (i.e. a truncated-scalar-normal RV with $T(x_1,\ldots,x_{n-1})\triangleq \sqrt{\max\left(0,\left(a^2-\sum_1^{n-1}x_i^2\right)\right)}$

Will $(X_1,X_2,\ldots,X_n)$ be a norm-constrained ($\geq a$) multivariate Gaussian? (i.e. same as $Y$ defined above). How should I verify? Any other suggestions if this is not the way?

EDIT:

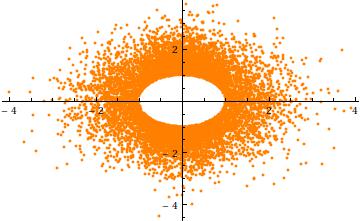
Here is a scatter-plot of the points in 2D case with norm truncated to values above "1" Norm-truncated multivariate Gaussian

Note: There are some great answers below, but the justification of why this proposal is wrong is missing. In fact, that's major point of this question.

$\endgroup$
6
  • 1
    $\begingroup$ @Xi'an Thanks for your query & interest. Here is my reasoning for your point: The algorithm in question needs RVs $X_1\ldots X_n$, that are $n-1$ Gaussians and a Truncated-Gaussian when they are seen per sample; more specifically, one of the distributions varies every sample. They are not the respective marginals. Because, each $x_i,i=1,\ldots,n-1$ appears in two terms: $x_i$ and $x_n$; and $x_n$ is clearly time varying as the truncation threshold varies for every sample. The decomposition proof that you provided has a problem in exactly the same sense. Marginals are just not available. $\endgroup$ Commented Jun 26, 2015 at 12:00
  • $\begingroup$ Your (incorrect) algorithm generates$$X_1,\ldots,X_{n-1}\sim \mathcal{N}(0,\sigma^2)$$first and then$$X_n\sim\mathcal{N}_T(0,\sigma^2)$$given $X_1,\ldots,X_{n-1}$. Hence, the first generation is from the marginal and the second generation is from the conditional. My proof shows the marginal is not a (n-1) dimensional Gaussian distribution. $\endgroup$
    – Xi'an
    Commented Jun 26, 2015 at 12:18
  • $\begingroup$ @Xi'an Conditional Gaussian does not mean Marginal Gaussian!! $\endgroup$ Commented Jun 26, 2015 at 12:22
  • $\begingroup$ @Xi'an Okay, my point is this. When $X_1,\ldots,X_{n-1}$ are generated as Gaussians, and later terms depend on these values, marginals of $X_1,\ldots,X_{n-1}$ won't be Gaussians. What you said is exactly the same. They might be "Conditionally Gaussian" but definitely not "marginally Gaussian". My earlier comment means that. $\endgroup$ Commented Jun 26, 2015 at 12:30
  • 1
    $\begingroup$ @Xi'an Thanks a lot for your patient answers. I finally understood my mistake with your stimulation, and I have also written my own detailed answer explaining the same. But sorry, hope you don't mind, I should probably accept whuber's answer for his detailed explanation that helps in actually solving the problem. $\endgroup$ Commented Jun 26, 2015 at 15:06

4 Answers 4

15
$\begingroup$

The multivariate normal distribution of $X$ is spherically symmetric. The distribution you seek truncates the radius $\rho=||X||^2$ below at $a$. Because this criterion depends only on the length of $X$, the truncated distribution remains spherically symmetric. Since $\rho$ is independent of the spherical angle $X/||X||$ and $\rho\,\sigma$ has a $\chi(n)$ distribution, you therefore can generate values from the truncated distribution in just a few simple steps:

  1. Generate $X \sim \mathcal{N}(0,\mathbb{I}_n)$.

  2. Generate $P$ as the square root of a $\chi^2(d)$ distribution truncated at $(a/\sigma)^2$.

  3. Let $Y = \sigma P\, X/||X||$.

In step 1, $X$ is obtained as a sequence of $d$ independent realizations of a standard normal variable.

In step 2, $P$ is readily generated by inverting the quantile function $F^{-1}$ of a $\chi^2(d)$ distribution: generate a uniform variable $U$ supported in the range (of quantiles) between $F((a/\sigma)^2)$ and $1$ and set $P = \sqrt{F(U)}$.

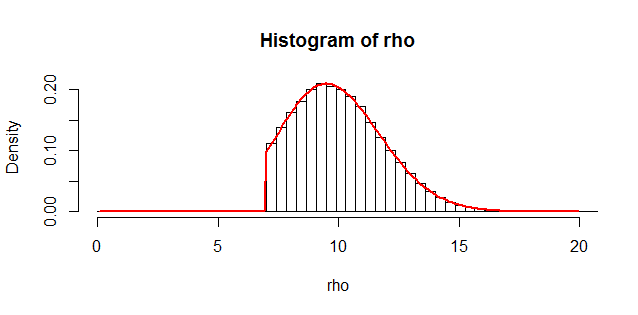
Here is a histogram of $10^5$ such independent realizations of $\sigma P$ for $\sigma=3$ in $n=11$ dimensions, truncated below at $a=7$. It took about one second to generate, attesting to the efficiency of the algorithm.
Figure

The red curve is the density of a truncated $\chi(11)$ distribution scaled by $\sigma=3$. Its close match to the histogram is evidence of the validity of this technique.

To get an intuition for the truncation, consider the case $a=3$, $\sigma=1$ in $n=2$ dimensions. Here is a scatterplot of $Y_2$ against $Y_1$ (for $10^4$ independent realizations). It clearly shows the hole at radius $a$:
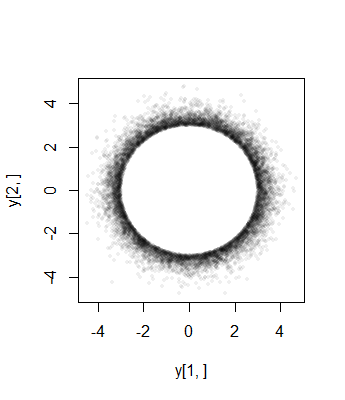
Figure 2

Finally, note that (1) the components $X_i$ must have identical distributions (due to the spherical symmetry) and (2) except when $a=0$, that common distribution is not Normal. In fact, as $a$ grows large, the rapid decrease of the (univariate) Normal distribution causes most of the probability of the spherically truncated multivariate normal to cluster near the surface of the $n-1$-sphere (of radius $a$). The marginal distribution must therefore approximate a scaled symmetric Beta$((n-1)/2,(n-1)/2)$ distribution concentrated in the interval $(-a,a)$. This is apparent in the previous scatterplot, where $a=3\sigma$ is already large in two dimensions: the points limn a ring (a $2-1$-sphere) of radius $3\sigma$.

Here are histograms of the marginal distributions from a simulation of size $10^5$ in $3$ dimensions with $a=10$, $\sigma=1$ (for which the approximating Beta$(1,1)$ distribution is uniform):
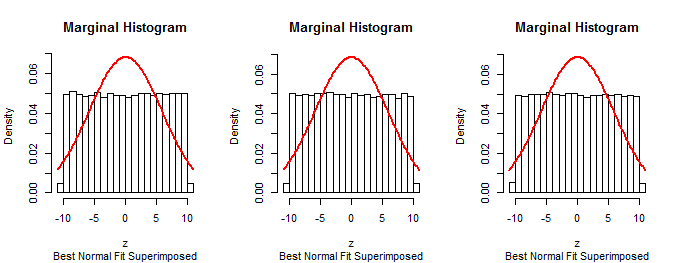
Figure 3

Since the first $n-1$ marginals of the procedure described in the question are normal (by construction), that procedure cannot be correct.


The following R code generated the first figure. It is constructed to parallel steps 1-3 for generating $Y$. It was modified to generate the second figure by changing variables a, d, n, and sigma and then issuing the plot command plot(y[1,], y[2,], pch=16, cex=1/2, col="#00000010") after y was generated.

The generation of $U$ is modified in the code for higher numerical resolution: the code actually generates $1-U$ and uses that to compute $P$.

The same technique of simulating data according to a supposed algorithm, summarizing it with a histogram, and superimposing a histogram can be used to test the method described in the question. It will confirm that method does not work as expected.

a <- 7      # Lower threshold
d <- 11     # Dimensions
n <- 1e5    # Sample size
sigma <- 3  # Original SD
#
# The algorithm.
#
set.seed(17)
u.max <- pchisq((a/sigma)^2, d, lower.tail=FALSE)
if (u.max == 0) stop("The threshold is too large.")
u <- runif(n, 0, u.max)
rho <- sigma * sqrt(qchisq(u, d, lower.tail=FALSE)) 
x <- matrix(rnorm(n*d, 0, 1), ncol=d)
y <- t(x * rho / apply(x, 1, function(y) sqrt(sum(y*y))))
#
# Draw histograms of the marginal distributions.
#
h <- function(z) {
  s <- sd(z)
  hist(z, freq=FALSE, ylim=c(0, 1/sqrt(2*pi*s^2)),
       main="Marginal Histogram",
       sub="Best Normal Fit Superimposed")
  curve(dnorm(x, mean(z), s), add=TRUE, lwd=2, col="Red")
}
par(mfrow=c(1, min(d, 4)))
invisible(apply(y, 1, h))
#
# Draw a nice histogram of the distances.
#
#plot(y[1,], y[2,], pch=16, cex=1/2, col="#00000010") # For figure 2
rho.max <- min(qchisq(1 - 0.001*pchisq(a/sigma, d, lower.tail=FALSE), d)*sigma, 
               max(rho), na.rm=TRUE)
k <- ceiling(rho.max/a)
hist(rho, freq=FALSE, xlim=c(0, rho.max),  
     breaks=seq(0, max(rho)+a, by=a/ceiling(50/k)))
#
# Superimpose the theoretical distribution.
#
dchi <- function(x, d) {
  exp((d-1)*log(x) + (1-d/2)*log(2) - x^2/2 - lgamma(d/2))
}
curve((x >= a)*dchi(x/sigma, d) / (1-pchisq((a/sigma)^2, d))/sigma, add=TRUE, 
      lwd=2, col="Red", n=257)
$\endgroup$
7
  • 1
    $\begingroup$ Thats a wonderful answer! But, can you also kindly throw some light on why the proposal-in-question fails? (Xi'an answer is not satisfactory enough, I see some problem with his argument e.g. when he integrates) $\endgroup$ Commented Jun 22, 2015 at 5:27
  • 1
    $\begingroup$ Thank you very much. But, may I also request you to answer on my first comment above? It seems, my proposal also gives a good histogram close enough. I am confused!! Where is the mistake? Note that, this is the main point of the question and IF CORRECT, the method needs just one "truncated-Gaussian" sample PLUS With the availability of existing fast algorithms, it leads to a huge savings (avoids divisions and multiplications, in addition to avoiding the need of relatively more complex truncated-ChiSquare) $\endgroup$ Commented Jun 22, 2015 at 16:28
  • 2
    $\begingroup$ As near as I can tell, you propose drawing $X_1,\ldots,X_{n-1}$ iid from a Normal distribution and $X_n$ from a two-sided truncated Normal. That is so obviously not a truncated MVN distribution, as a scatterplot for $n=2$ will easily reveal, that I believe I have been unable to understand that part your question. More generally, the burden of questions that ask why something does not work is on the asker to provide evidence that it does work. Perhaps if you supplied such evidence, the nature of your question would become clear. $\endgroup$
    – whuber
    Commented Jun 22, 2015 at 17:27
  • 1
    $\begingroup$ Thanks for the details. I added a 2-D scatter-plot as you said and fixed a few sentences. By the way, sorry I didn't really mean to transfer the total burden of proof to you. My proposal seems to work okay with all simple checks, therefore I am curious why its wrong, which is also the main purpose of this question. $\endgroup$ Commented Jun 23, 2015 at 4:35
  • 1
    $\begingroup$ Looking at the marginal distributions is the most straightforward way I could find to illustrate the differences in the procedures. I added a figure and some code to show these marginals. $\endgroup$
    – whuber
    Commented Jun 23, 2015 at 14:27
8
$\begingroup$

I have written this assuming that you don't want any points having ||y|| > a, which is the analogue of the usual one dimensional truncation. However, you have written that you want to keep points having |y|| >= a and throw out the others. Nevertheless, the obvious adjustment to my solution can be made if you really do want to keep points having |y|| >= a.

The most straightforward way, which happens to be a very general technique, is to use Acceptance-Rejection https://en.wikipedia.org/wiki/Rejection_sampling . It will be fairly fast as long as Prob(||X|| > a) is fairly low, because then there will not be many rejections.

Generate a sample value x from the unconstrained Multivariate Normal (even though your problem states that the Multivariate Normal is spherical, the technique can be applied even if it's not). If ||x|| <= a, accept, i.e., use x, otherwise reject it and generate a new sample. Repeat this process until you have as many accepted samples as you need. The effect of applying this procedure is to generate y such that its density is c * f_X(y), if ||y|| <= a, and 0 if ||y|| > a, per my correction to the opening portion of your question. You never need to compute c; it is in effect auto-determined by the algorithm based on the frequency with which samples are rejected.

$\endgroup$
2
  • 3
    $\begingroup$ +1 I like that your proposal works with non-spherically symmetric MVNs, that you have clearly described the circumstances under which it will be effective, and that you emphasize the need to assess the rejection rate when deciding whether to use rejection sampling. $\endgroup$
    – whuber
    Commented Jun 21, 2015 at 16:44
  • 2
    $\begingroup$ Yes, and also note that it can work for arbitrarily shaped acceptance region(s), not just 2-norm being above or below a threshold as here. $\endgroup$ Commented Jun 21, 2015 at 16:52
5
$\begingroup$

This is a nice attempt but it does not work because of the "normalisation constant": if you consider the joint density $$f_X(x) \propto \frac{1}{{(2\pi\sigma^2)}^{n/2}} \exp\left(-\frac{||x||^2}{2\sigma^2}\right)\mathbb{I}_{||x||>a}=\frac{1}{{(2\pi\sigma^2)}^{n/2}} \exp\left(-\frac{x_1^2+\ldots+x_n^2}{2\sigma^2}\right)\mathbb{I}_{||x||>a}$$the decomposition $$f_X(x) \propto \frac{1}{{(2\pi\sigma^2)}^{(n-1)/2}} \exp\left(-\frac{||x_{-n}||^2}{2\sigma^2}\right)\frac{1}{{(2\pi\sigma^2)}^{1/2}} \exp\left(-\frac{x_n^2}{2\sigma^2}\right)\mathbb{I}_{||x||>a}$$ $$=\frac{1}{{(2\pi\sigma^2)}^{(n-1)/2}} \exp\left(-\frac{||x_{-n}||^2}{2\sigma^2}\right)\frac{1}{{(2\pi\sigma^2)}^{1/2}} \exp\left(-\frac{x_n^2}{2\sigma^2}\right)\mathbb{I}_{||x_{-n}||^2+x_n^2>a^2}$$ $$=\frac{\mathbb{P}(X_n^2>a^2-||x_{-n}||^2)}{{(2\pi\sigma^2)}^{(n-1)/2}} \exp\left(-\frac{||x_{-n}||^2}{2\sigma^2}\right)\qquad\qquad\qquad\qquad\qquad$$ $$\qquad\qquad\qquad\times\frac{\mathbb{P}(X_n^2>a^2-||x_{-n}||^2)^{-1}}{{(2\pi\sigma^2)}^{1/2}} \exp\left(-\frac{x_n^2}{2\sigma^2}\right)\mathbb{I}_{x_n^2>a-||x_{-n}||^2}$$ which integrates to $$f_{X_{-n}}(x_{-n}) \propto \frac{\mathbb{P}(X_n^2>a^2-||x_{-n}||^2)}{{(2\pi\sigma^2)}^{(n-1)/2}} \exp\left(-\frac{||x_{-n}||^2}{2\sigma^2}\right)$$ in $x_n$, shows that

  1. The conditional distribution of $X_n$ given the other components, $X_{-n}$, is a truncated normal distribution;
  2. The marginal distribution of the other components, $X_{-n}$, is not a normal distribution because of the extra term $\mathbb{P}(X_n^2>a^2-||x_{-n}||^2)$;

The only way I can see in taking advantage of this property is to run a Gibbs sampler, one component at a time, using the truncated normal conditional distributions.

$\endgroup$
1
  • 1
    $\begingroup$ Thanks a lot for the detailed answer. Just a clarification, the area under your density $f_X(x)$ (second eq) doesn't sum to 1!! --- I think, once it is corrected, it will cancel out the "normalization factor" that you are talking about. Any thoughts? $\endgroup$ Commented Jun 21, 2015 at 11:41
3
$\begingroup$

The question originates from the idea of using -- the basic conditional-decomposition of joint distributions -- in order to draw vector samples.

Let $X$ be a multivariate Gaussian with i.i.d. components.

Let $\text{Prob}(||X||>a) \triangleq T$ and $Y\triangleq X.\mathbb{I}_{||X||>a}$

The algorithm in question is proposed based on the following (all-correct but deceiving-interpretation) conditional-factorization: $$f_Y(y) = \frac{1}{T}\frac{1}{{(2\pi\sigma^2)}^{n/2}} \exp\left(-\frac{||y||^2}{2\sigma^2}\right)\mathbb{I}_{||y||>a}\\ =\frac{1}{T}\frac{1}{{(2\pi\sigma^2)}^{n/2}} \exp\left(-\frac{y_1^2+\ldots+y_n^2}{2\sigma^2}\right)\mathbb{I}_{||y||>a}\\ =\left(\prod_{i=1}^{n-1} \frac{1}{\sqrt{2\pi\sigma^2}} \exp\left(-\frac{y_i^2}{2\sigma^2}\right)\right) \left(\frac{1}{T}\frac{1}{\sqrt{2\pi\sigma^2}} \exp\left(-\frac{y_n^2}{2\sigma^2}\right)\mathbb{I}_{||y||>a}\right)\\ =\underbrace{\left(\prod_{i=1}^{n-1} \frac{1}{\sqrt{2\pi\sigma^2}} \exp\left(-\frac{y_i^2}{2\sigma^2}\right)\right)}_{\text{Gaussians}} \underbrace{\left(\frac{1}{T}\frac{1}{\sqrt{2\pi\sigma^2}} \exp\left(-\frac{y_n^2}{2\sigma^2}\right)\mathbb{I}_{y_n^2>(a^2-y_1^2-\ldots y_{n-1}^2)}\right)}_{\text{Truncated Gaussian??}} $$

The shortest answer is that the latter factor is not a truncated Gaussian, (more importantly) not even a distribution.


Here is the detailed explanation of why the above factorization itself has some fundamental flaw. In a single sentence: any conditional-factorization of a given joint distribution must satisfy some very fundamental properties, and the above factorization doesn't satisfy them (See below).

In general, if we ever factorize $f_{XY}(x,y)=f_X(x)\cdot f_{Y|X}(y|x)$ then $f_X(x)$ is the marginal of $X$ and $f_{Y|X}(y|x)$ is the conditional distribution of $Y$. Which means:

  1. The factor of $f(x,y)$ "assumed as" $f_X(x)$ must be a distribution. And,
  2. The second factor "assumed as" $f_{Y|X}(y|x)$ must be a distribution for every choice of $x$

In the above example, we are trying to condition as $Y_n|(Y_1\ldots Y_{n-1})$. It means the property-1 should hold for the factor of Gaussians and property-2 should hold good for the latter part.

It is clear that the property-1 holds good on the first factor. But The problem is with the property-2. The last factor above is unfortunately not a distribution at all (forget about Truncated Gaussian) for almost any value of $(Y_1\ldots Y_{n-1})$!!


Such a proposal of algorithm is probably a result of the following misconception: Once a distribution naturally factors out of a joint distribution (such as Gaussians in above), it leads to a conditional factorization. ---- It does not! ---- The other (second) factor must also be good.


Note: There is a great answer by @whuber earlier, that actually solves the problem of generating a norm truncated multivariate Gaussian. I am accepting his answer. This answer is only to clarify & share my own understanding and the genesis of the question.

$\endgroup$
1
  • 2
    $\begingroup$ +1 Thank you for sharing your thoughts: they add valuable insight to this thread. $\endgroup$
    – whuber
    Commented Jun 26, 2015 at 15:59

Your Answer

By clicking “Post Your Answer”, you agree to our terms of service and acknowledge you have read our privacy policy.

Not the answer you're looking for? Browse other questions tagged or ask your own question.