20
$\begingroup$

What is the best way graphically to visualize a 3-D density function? As in I would like to visualize $$z=f_{X,Y}(x,y)$$?

Not necessary but R code for this would be great.

$\endgroup$
15
  • 3
    $\begingroup$ I changed it to be more statistical. $\endgroup$
    – user30490
    Commented Sep 19, 2013 at 21:27
  • 1
    $\begingroup$ If there's something lacking about those options, it will be most helpful if you can specify what it is & what exactly your needs are so that we can find a kind of visualization that might better suit them. $\endgroup$ Commented Sep 19, 2013 at 21:35
  • 1
    $\begingroup$ Those are adequate sure but what are my other options/ $\endgroup$
    – user30490
    Commented Sep 19, 2013 at 21:36
  • 3
    $\begingroup$ @nico, I don't think this would have been off-topic / better suited for SO even before the changes. The request for code was specified as optional, & data-visualization is part of our mandate. $\endgroup$ Commented Sep 19, 2013 at 21:38
  • 1
    $\begingroup$ @whuber, the original question was just "visualize a 3D dataset" (you can see it in the edit history). I take that to be on-topic, although your point, as made, is clearly correct. $\endgroup$ Commented Sep 19, 2013 at 21:43

1 Answer 1

28
$\begingroup$

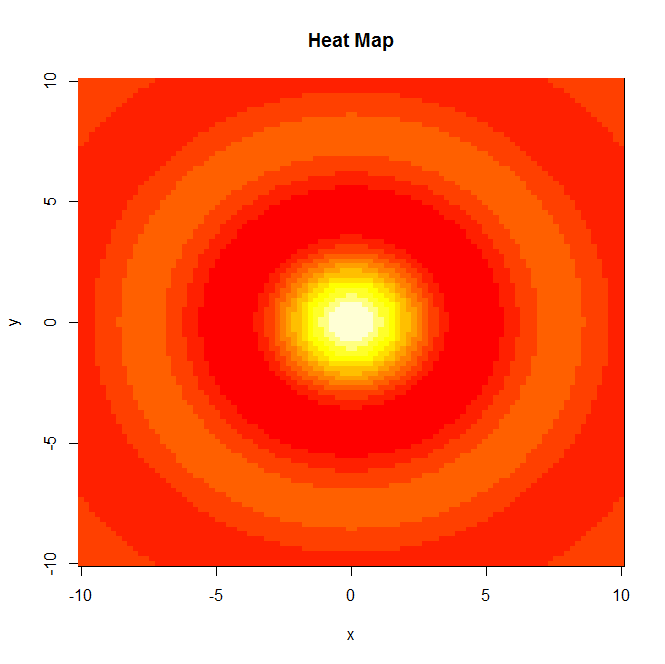
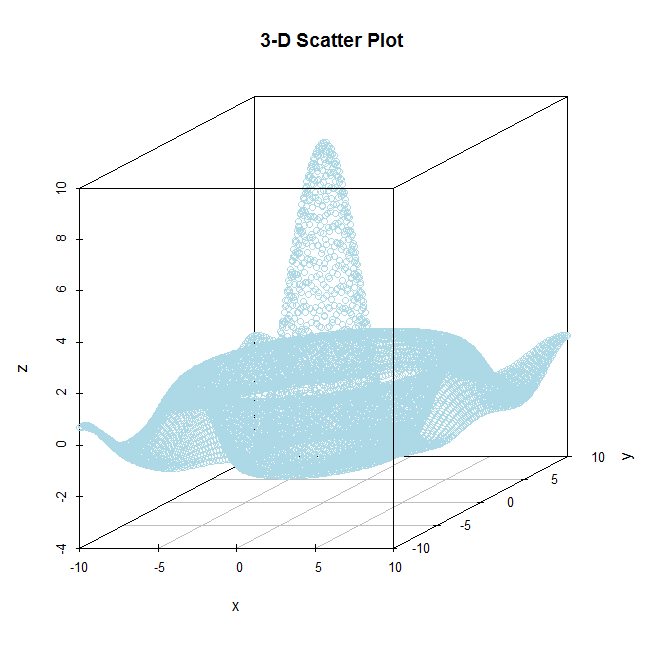
Well there are four possible approaches that come to mind (although I am sure that there are many more) but basically you could either plot the data as a perspective plot, a contour plot, a heat map or if you prefer a 3-D scatter plot (which is more or less a perspective plot when you have values of $z$ for all $(x,y)$ pairs. Here are some examples of each (from a well known 3-D data set in R):
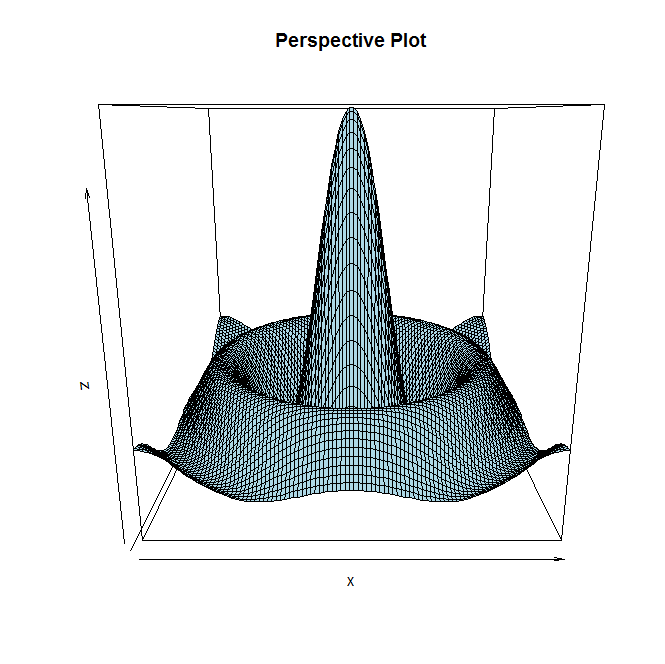
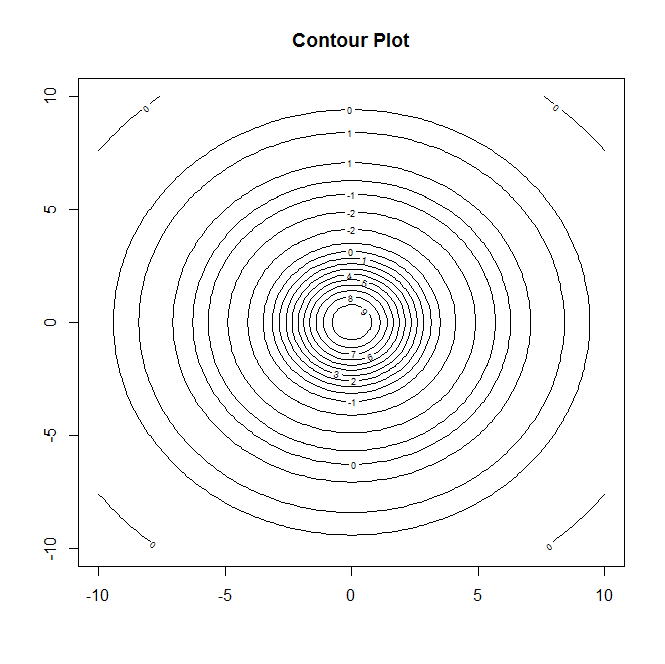
enter image description here enter image description here enter image description here enter image description here

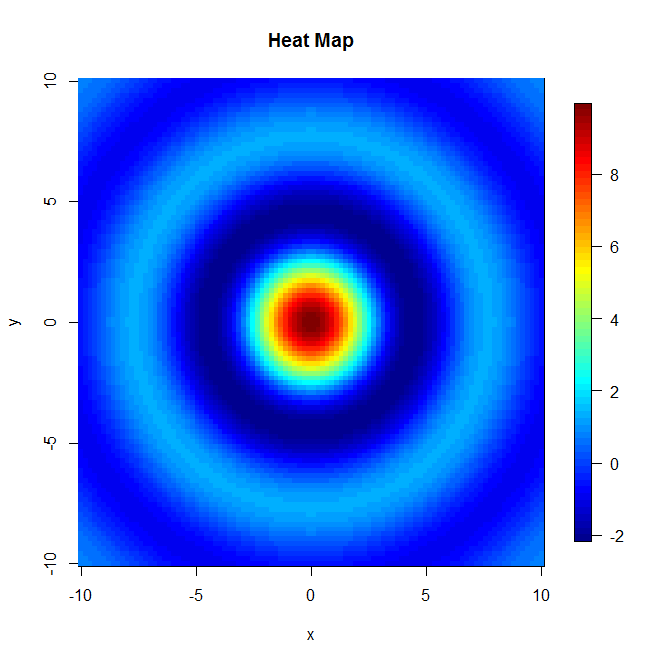
Here are two additional plots that have nicer plotting features than the ones given prior. enter image description here enter image description here So depending on your preference will dictate which way you like to visualize 3-D data sets.
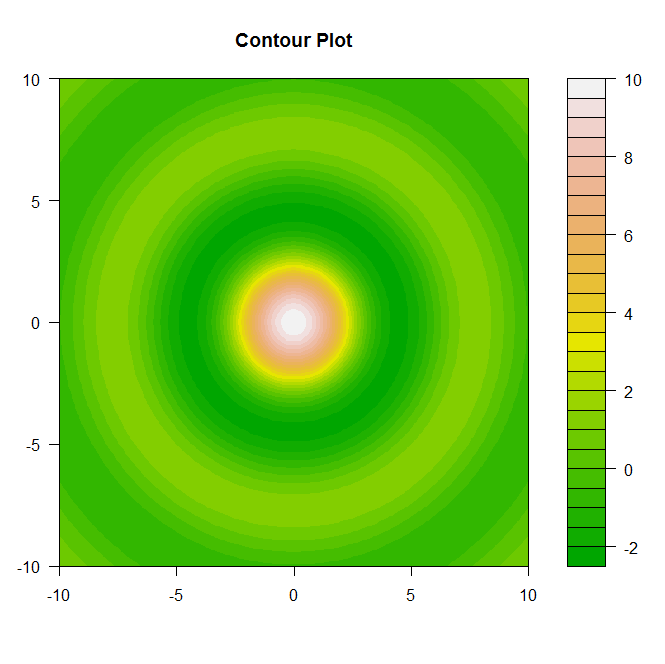
Here is the `R` code used to generate these four mentioned plots.
library(fields)
library(scatterplot3d)

#Data for illistarition
x = seq(-10, 10, length= 100)
y = x
f = function(x, y) { r = sqrt(x^2+y^2); 10 * sin(r)/r }
z = outer(x, y, f)
z[is.na(z)] = 1

#Method 1
#Perspective Plot
persp(x,y,z,col="lightblue",main="Perspective Plot")

#Method 2
#Contour Plot
contour(x,y,z,main="Contour Plot")
filled.contour(x,y,z,color=terrain.colors,main="Contour Plot",)

#Method 3
#Heatmap
image(x,y,z,main="Heat Map")
image.plot(x,y,z,main="Heat Map")

#Method 4
#3-D Scatter Plot
X = expand.grid(x,y)
x = X[,1]
y = X[,2]
z = c(z)
scatterplot3d(x,y,z,color="lightblue",pch=21,main="3-D Scatter Plot")
$\endgroup$
12
  • 1
    $\begingroup$ That heatmap is blinding. $\endgroup$ Commented Sep 19, 2013 at 21:47
  • $\begingroup$ @Gung, (or anyone really) do you know if there is a was to add a side bar that tells what the values the colors of the heatmap correspond to? That is of course using the image command. $\endgroup$
    – user25658
    Commented Sep 19, 2013 at 21:50
  • 4
    $\begingroup$ I think you want the image.plot() command to add a color bar. Also, filled.contour() generates a similar plot with a color bar added by default. $\endgroup$
    – Macro
    Commented Sep 19, 2013 at 22:03
  • 6
    $\begingroup$ Mama always told me not to look into the eyes of the sun, @GavinSimpson. $\endgroup$ Commented Sep 19, 2013 at 22:10
  • 2
    $\begingroup$ While we're here, I'll just point out that you can customize the color palette any way you want... The easiest (but probably not the best) way to do this is using colorRampPalette(), e.g. if you type a = colorRampPalette(c('dark blue','blue','light blue','yellow','orange', 'red','dark red')) it creates a function a that generates a discrete approximation of a color continuum that passes through those colors. The argument to a is an integer that determines the resolution of this discrete approximation. $\endgroup$
    – Macro
    Commented Sep 19, 2013 at 22:12

Your Answer

By clicking “Post Your Answer”, you agree to our terms of service and acknowledge you have read our privacy policy.