3
$\begingroup$

I have been reading a lot on Cross Validated for a while now, but this is my first post here. Thanks for all the help I've received! I am currently working on a project where we are trying to estimate the effects of a drug on overall and disease-specific mortality. This is a prospective observational study, where patients are enrolled when they have a blood test, which happens at different time points. Patients are then followed until death, emigration, or the end of the study. To figure out if the drug impacts mortality, we have set up a Cox regression model where drug exposure is allowed to accumulate over time with the cumtdc function specified here.

The problem is that the proportional hazards assumption is severely violated - with p-values approaching 0 for most of the covariates. I am a beginner to this type of analysis and what I have read and tried so far is:

  • Splitting continuous variables (such as age) into categories, which did not make a difference.
  • Could interaction variables be helpful here - if so, how do I best implement them?
  • Would this analysis be better suited to be performed with an accelerated failure time model?
  • Is it possible that the analysis could be valid despite the non-proportional hazards? I am asking this since, intuitively, there are many individuals in the study (> 300 000) and many events (> 30 000), so even minimal violations might be registered as significant.

I am attaching the Schoenfeld plots with the respective p-values for the covariables.
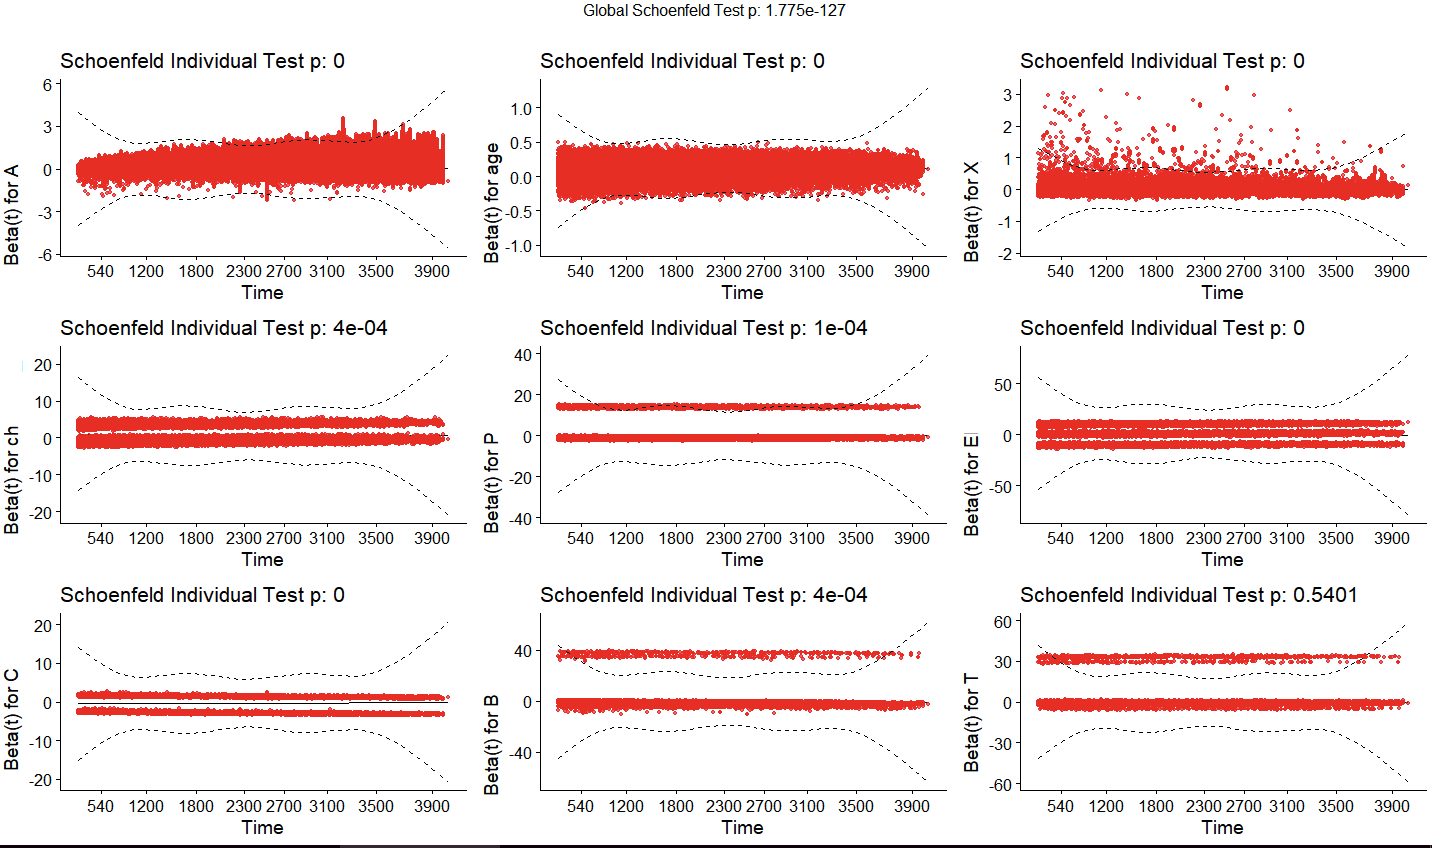
Schoenfeld plot

I would be most appreciative of any suggestions to this problem. There seem to be many different approaches out there, making it a bit tricky to navigate for a beginner. Thank you!

ADDITON TO ORGINAL QUESTION

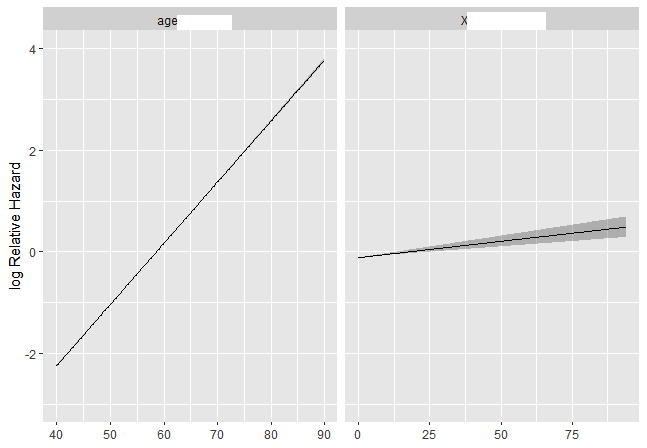
These are the log hazards for the variables age and X. I have now attempted both restricted cubic splines and categorization without meaningful changes to the Schoenfeld residuals.

log hazards for age and X

ADDITION 2 TO ORIGINAL QUESTION

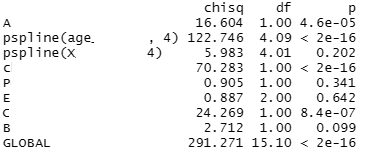
The output from cox.zph:

enter image description here

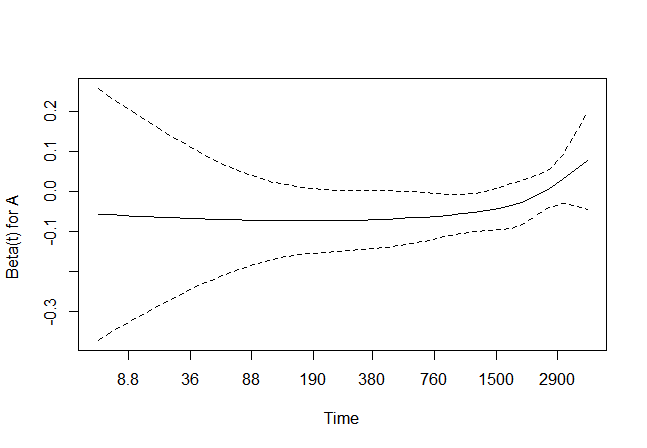
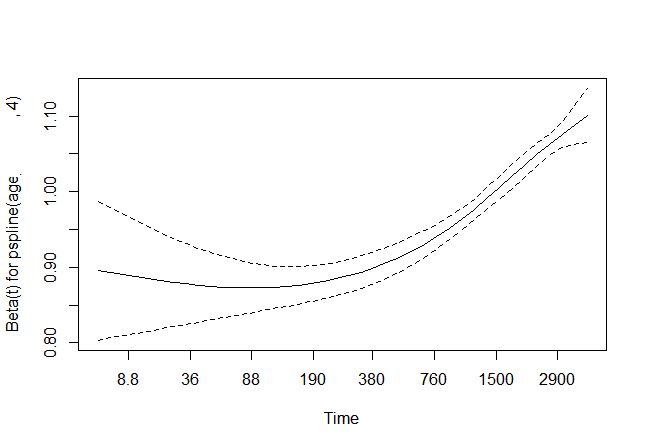
The requested plots from cox.zph for A and age:

enter image description here enter image description here

$\endgroup$

2 Answers 2

2
$\begingroup$

With a data set this large, you are facing a problem similar to that with normality testing: any large real-world data set will tend to show a statistically "significant" deviation from an ideal. You thus have to engage closely with the data, using your knowledge of the subject matter to evaluate whether any deviations from proportional hazards (PH) are large enough to matter. This answer addresses the problem in the PH context, with suggestions for some graphical evaluations and for further reading.

With respect to your data set, it looks to me like most of your predictors don't deviate very far from constant hazards over time. The apparently categorical predictors (the last 6) seem quite flat. The coefficient for predictor A does, however, seem to show a tendency to increase over time. There also seem to be more high-positive residuals for X at early times than at late times. You might want to evaluate those more closely, based on your understanding of the subject matter. With continuous predictors (as A and X seem to be), an improper transformation might be the underlying problem, if their values aren't linearly associated with log hazards. Flexible modeling of those predictors with restricted cubic splines might fix the problem.

With the risk of survivorship bias, modeling with time-dependent covariates as you are doing is tricky enough. Be extra cautious if you think that you also need to move to time-dependent coefficients as in the vignette that you cite. Be warned that if you use the time-transform formalism to express coefficients as a function of time, the cox.zph() function can't be used to evaluate PH. This answer describes that and some other things that you might need to consider when using recent versions of the R survival package.

$\endgroup$
7
  • $\begingroup$ Thank you so much for the great reply! I have attached another image showing the log hazard relationship between age and X. It actually seems to be age that is causing a lot of the problems with the non-proportional hazards. It does not help with restricted cubic splines or categorization - am I missing something here? It appears to be the older ages causing the problems, since restricting age to < 75 fixes the problem. Is this due to the non-linear effect of mortality on age or something else I have not thought of? $\endgroup$
    – Rich R
    Commented Dec 9, 2020 at 6:48
  • $\begingroup$ Two other things that would be good to see are the text output of R survival::cox.zph and the residual plots without the points, which may distort the scale. You may also want to further check your accelerated failure time idea to see if residuals from e.g. a log-normal survival model are better behaved (noting that your Cox residuals may already be well behaved enough). See my case study in parametric survival modeling for an example, here - in the course notes. $\endgroup$ Commented Dec 9, 2020 at 12:10
  • $\begingroup$ @LarsB the information that Frank Harrell requested would help evaluate the Cox model, and do explore his suggestion about accelerated failure time models as an alternative. The "fix" of the Cox model by restricting age to <75 indicates that you might have found something of biological/clinical importance. Look at interactions of one or more of your predictors with age, or try a model stratified by age (again, potentially with an interaction of age strata with one or more predictors) to follow up on that. $\endgroup$
    – EdM
    Commented Dec 9, 2020 at 15:21
  • $\begingroup$ Thanks, @FrankHarrell and EdM, for your suggestions. I have attached some of the requested plots and text output of the cox.zph function. Perhaps a way to proceed would be to use the SurvSplit function and interpret HRs for different time spans for the variable I am interested in. $\endgroup$
    – Rich R
    Commented Dec 13, 2020 at 14:36
  • $\begingroup$ For the plots it's best to combine the effects of the spline terms. I think that cox.zph has a new option to do that easiily. $\endgroup$ Commented Dec 13, 2020 at 14:45
0
$\begingroup$

I have a very similar related question.

Not an expert, but based on what I've researched so far and what is highlighted on this page, here are some points that may be helpful in answer to your last question

Is it possible that the analysis could be valid despite the non-proportional hazards?

  1. As others have mentioned, large sample size may be a factor leading to the violation of the statistical test of the PH assumption. As @EdM mentioned, it will depend on your context/knowledge of the subject as to whether the deviations matter.

From page 1461 of this paper

When the sample size is small, this method may lack power to detect deviations from PH; while for large sample sizes, hypothesis tests may be over sensitive to slight deviations from this assumption.

  1. The answer to this question suggests that the effect of fitting a Cox model with non-proportional hazards is "slightly less power" which can be recovered with robust standard errors, leading to the hazard ratios being interpreted as the time-weighted average of the hazard ratio

  2. This interesting paper (Why Test for Proportional Hazards?) was published recently highlighting that there are legitimate reasons to assume violation of PH, and that one of the effects is on the interpretation rather than invalidity of the results. They actually suggest that statistical testing of PH is unnecessary if it's expected that the hazard ratio varies over time. (I'd be interested to hear what others think of this paper)

In the section "How should hazard ratios be interpreted?" on page 1402

As a weighted average of the time-varying hazard ratios, the hazard ratio estimate from a Cox proportional hazards model is often used as a convenient summary of the treatment effect during the follow-up. However, a hazard ratio from a Cox model needs to be interpreted as a weighted average of the true hazard ratios over the entire follow-up period. The 95% confidence interval should be estimated using a valid method such as bootstrapping and also using inverse probability weighting to adjust for losses to follow-up.

$\endgroup$

Your Answer

By clicking “Post Your Answer”, you agree to our terms of service and acknowledge you have read our privacy policy.

Not the answer you're looking for? Browse other questions tagged or ask your own question.