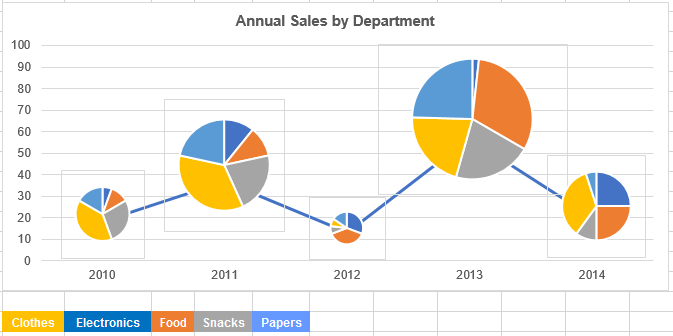
I've created a sketch of a chart that combines a line graph with pie charts at each point on the line graph. I want to know if there's a standard name for this type of combined graph. I have tried various keywords in Google search but haven't gotten any satisfactory results. Ultimately, I want to find a library to build this type of combined chart programmatically, e.g. using Javascript, etc. I am hoping a standardized name for it will assist me in my search for a programming library to do this visualization.
1 Answer
$\begingroup$
$\endgroup$
Not common or notable enough for a standard name, but you'll find some info by searching for "pie chart as symbol" or "pie chart as marker". Basically you have a line plot and scatter plot where each scatter marker is replaced with a pie chart.
Related question showing code for making a similar plot: https://stackoverflow.com/questions/24052868/can-we-create-pie-chart-and-scatter-plot-combined-using-highcharts-js

